Calibration curves for grouped compounds

Hello,

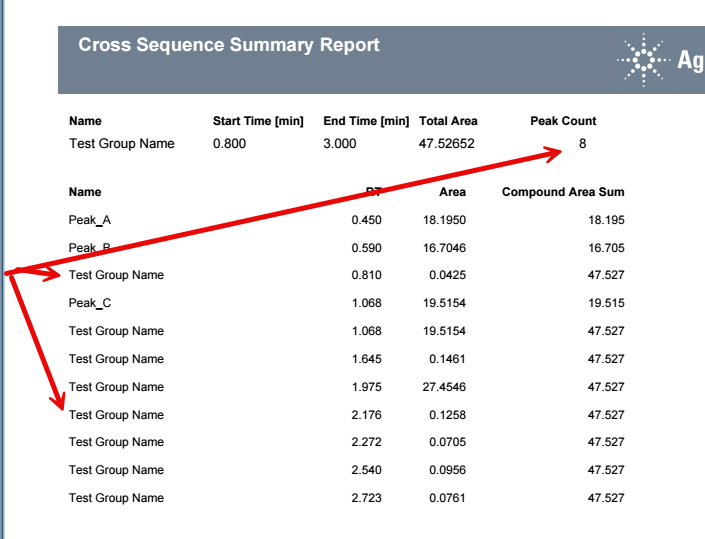
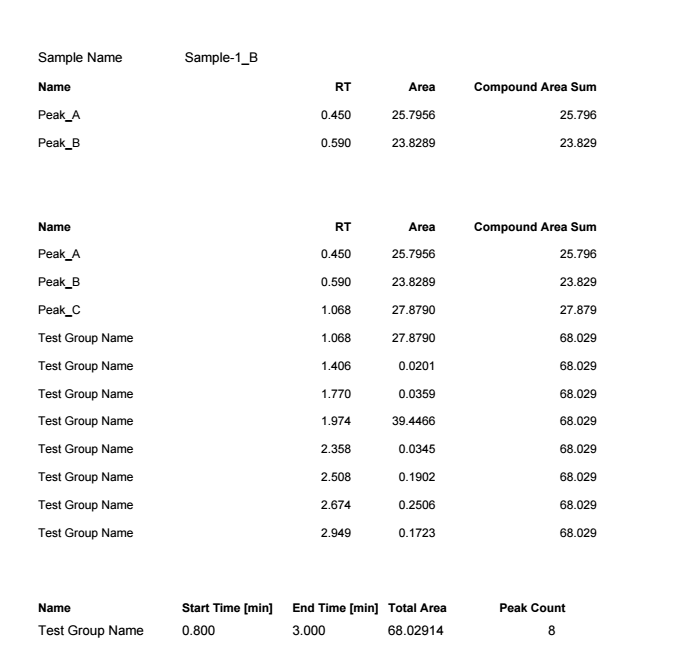
Is there a way to produce a calibration curve for compound groups? We have a specific analyte that reacts to form a very similar analyte. In our assays, we currently sum their areas for all calculation of recovered concentrations. We would like to be able to do this in data analysis then have it transfer over to intelligent reporter like single compound curves do. Is this even possible? We have OL CDS 2.5.

Thanks,

Cole

Parents Reply Children
  • Hello,

    It is not the same as named groups so the Compound_GroupName does not work. If you have peaks in a timed group, they end up being named with the timed group name if they are unknowns. If they are named, you kind of end up with a second duplicate peak that is that same peak as a member of the timed group. You can setup the tables to be able to see both versions or remove the duplicate peaks. There are tables in the snippets list that are designed to display summed peaks that can be used as well. You could use a table like that and include the count of peaks to check the range was including the peaks of interest. 

    Marty

     \

  • Alright, sounds like I will have to come up with something. The problem is more about filtering out the individual peaks from other tables since they will be assessed in the group table. I have a few ideas already so don't worry about it

  • Hello,

    If that is what you need, place a hidden field at the top of the report, grouped with itself, and repeated on RT. in the field, make the value =If(Count(Peak_RetentionTime)>1,1,0) and then store the value as a variable keyed on Peak_RetentionTime. If this is for a summary report, I would repeat the field again by injection ID. You can then use that flag in tables to allow only peaks that do not have a duplicate(grouped) peak. The 2 tables below are identical except the first table has a filter for if the stored value = 0. You can change the logic of the flag as you see fit. 

    Marty Adams

Was this helpful?