Hello! Anyone know why my calibrate curve from Data Analysis are different from excel?
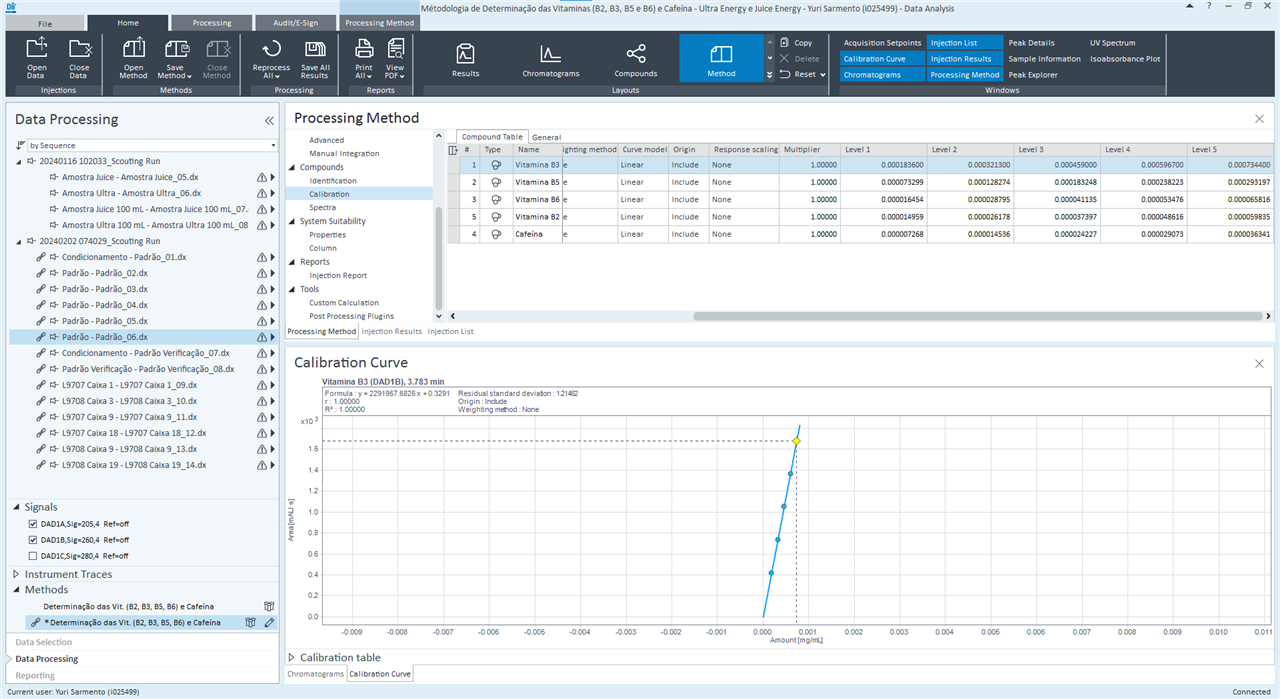
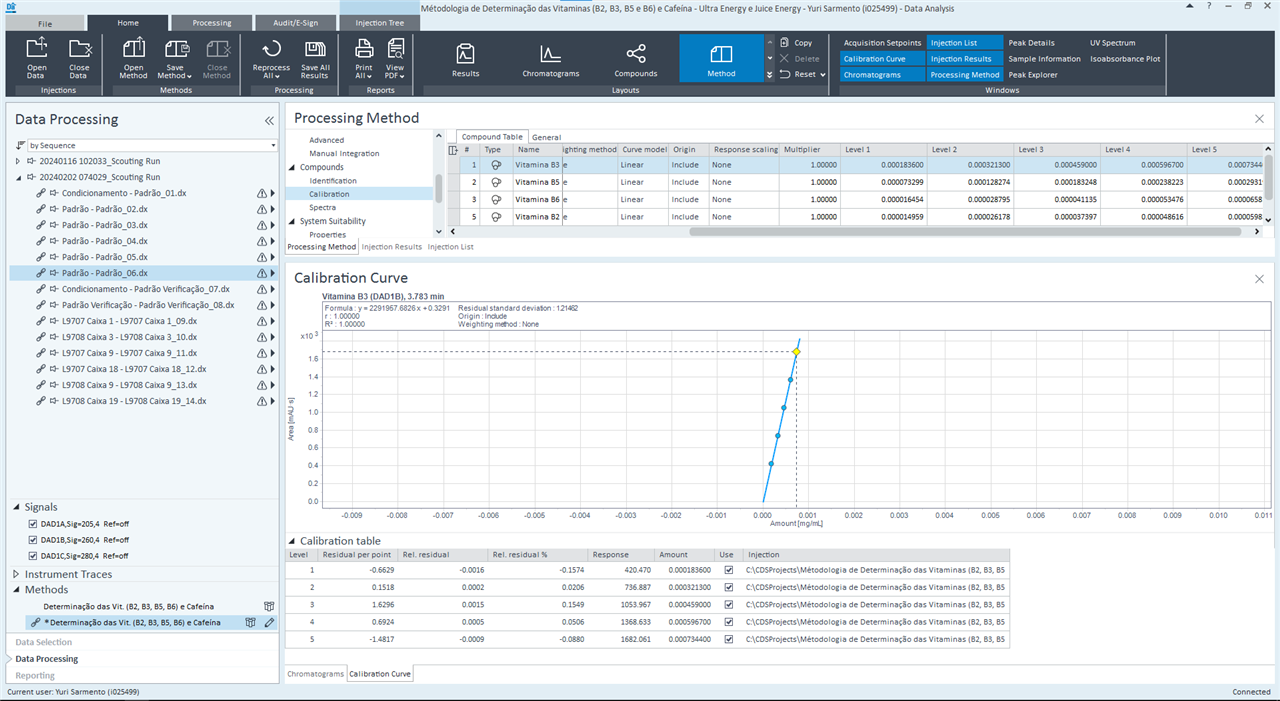
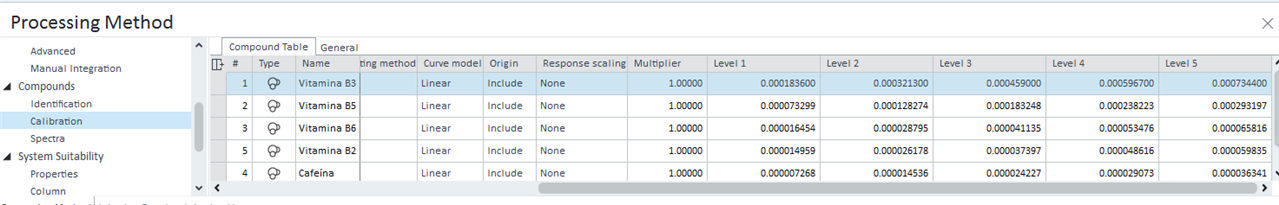
This is my calibrate curve from Vit B3
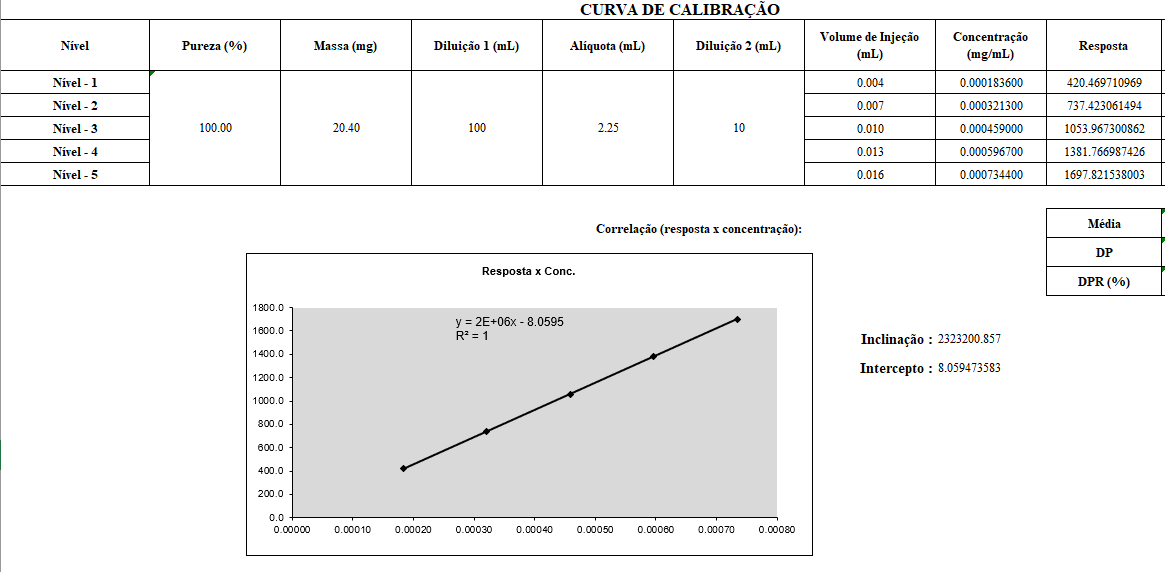
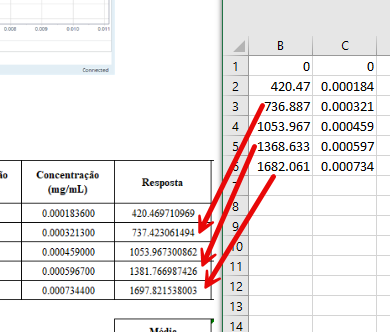
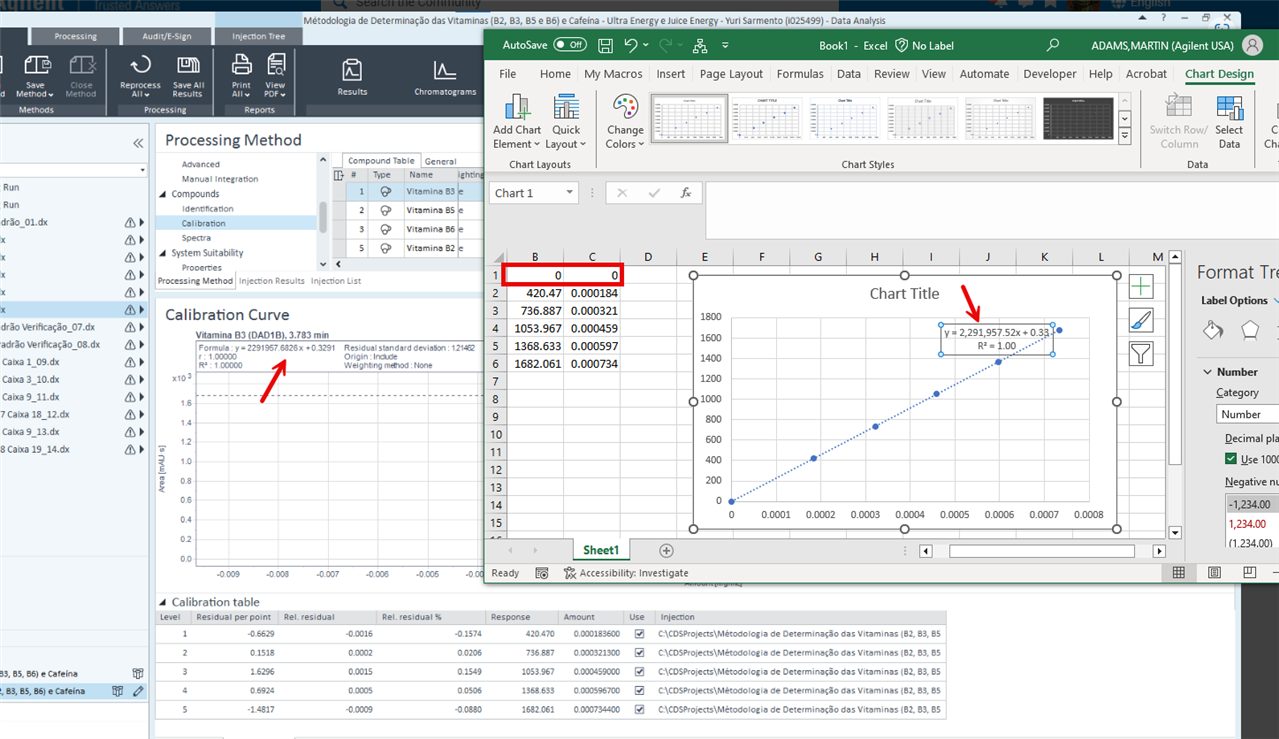
And this is from excel.
If someone could help me, I will be grateful
Hello! Anyone know why my calibrate curve from Data Analysis are different from excel?
This is my calibrate curve from Vit B3
And this is from excel.
If someone could help me, I will be grateful