M/z and RT on one table in OpenLab CDS Version 2.4

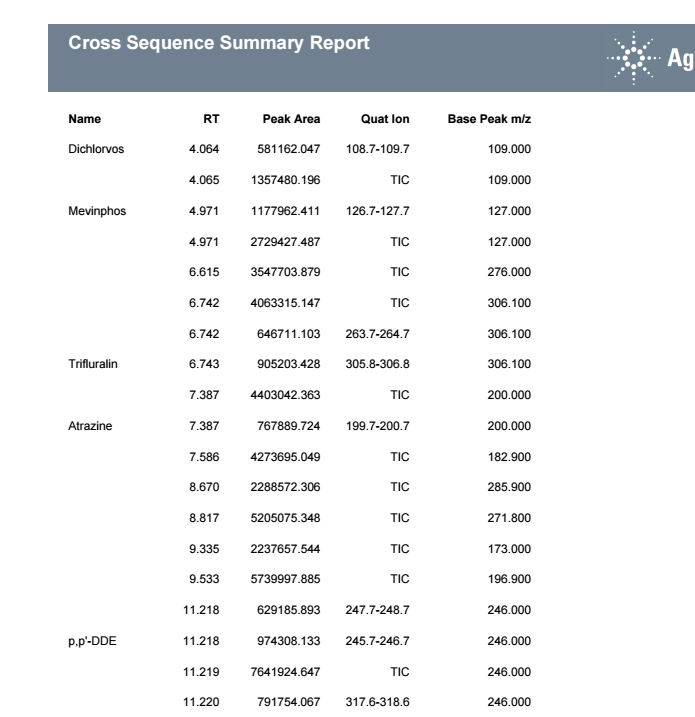
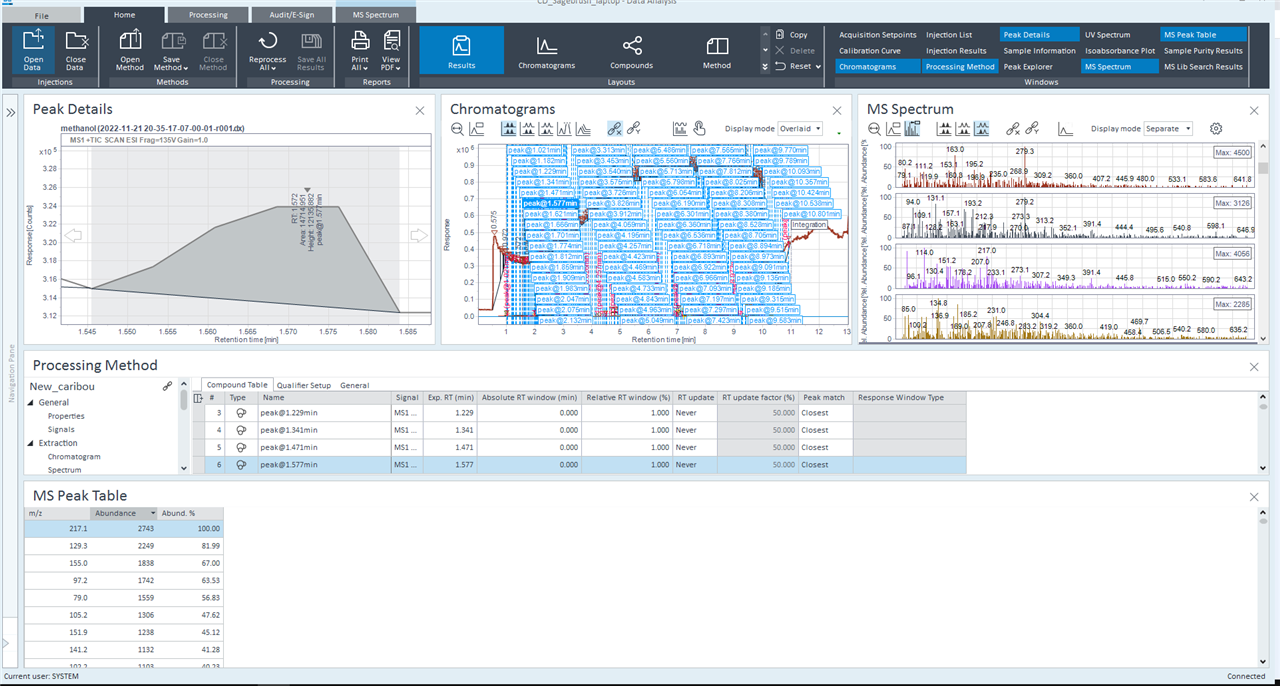
We have Openlabs CDS 2.4 on our LCMS. I want to create a table that has retention time, m/z ratio and abundance on it for each sample but cannot figure out how to do this. When I look at the compound table, there is no option to add a column with m/z and when I look at the MS spectrum table, there is no place to add retention time.

thank you

Debbie

Parents Reply
  • Hello,

    The quant signal could be the TIC, a SIM channel, or the EIC signal where the peak was integrated. In the example, I set it up to show the MZ from signal channel name or TIC depending on the signal where the peak was found. The base peak M/Z is the most abundant ion in the spectra for an integrated peak found in a signal channel. I checked and you should have the Peak_BasePeakMass as an option in the IR reports for CDS 2.4.  

    Marty 

Children
No Data
Was this helpful?