Curve coefficient didn't correspond to the average.

Hi, 

First, I want to show how I perfomed my 1 level calibration curve. 
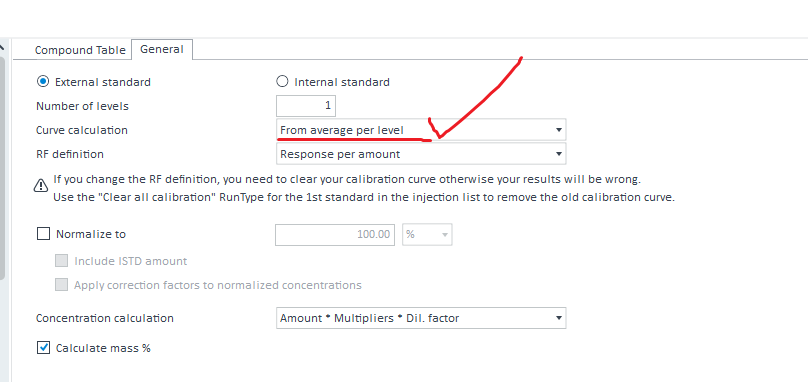
We saw that I asked for the average when several calibration standards are used and contained the same target compound. 

We do have the TFT in each of my 4 calibration standards. 

We can see it at my section filtered for Cal std only. 

What's weird here it's the first RF calculated is good (1083376/9.8 = 110549) but all the other ones are wrong. 

If we take the 2nd one and did the same calculation (1110109/9.8= 113276) and the software gave 111912. 

I don't know where this 111912 result is coming from. 

Here my injection list that shows how I performed my calibration.
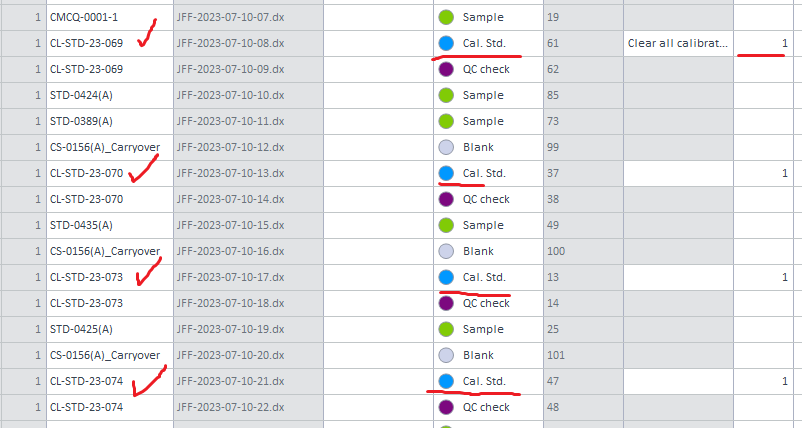
Is it because my Cal.Std are not injected one immediately after another? 

I can see on my calibration curve that I has four point but the coefficient a given in the table is coming from the first injection only and not the average like I choose on the method process. 
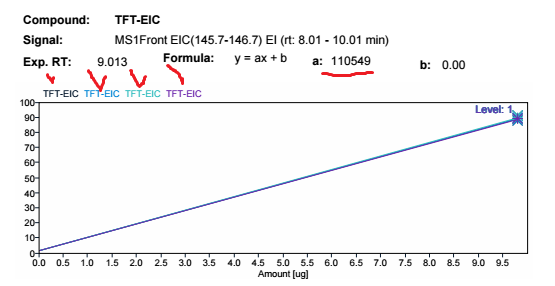
We can't see that the a coeffiecient on the curbe at 110549 is coming from the first injection. 

So it seems that the Curve calculation is not with the average of the four peaks.

Why ?

thank you


Parents
  • OL's RF handling is terrible...  My solution: At the beginning of the report, i've created a textbox, filtered for Cal type only. Value=max(Sample_AcquisitionOrderNo), saved this as STDLastRow  variable. Then there is a compound table, filtered by STDlastrow, where the RF values are displayed & stored in an array(like RepRF). For unique key value the compound_name was given. If everything is ok, you can display the correct RF value at every page with =RepRF(Compound_Name). Next issue: for missing peaks, there are no RFs. Hate this... So create a textbox, group it by compound_name. filter : " =IIF( Double.IsNaN( Code.DVL.GetValue(Compound_Name & "RepRF")), 1, 0)    =   0 That's it. Place this group where you want, every compound's RF will be there.

  • Oh, srry, i forgot something. The Lastrow extractor Textbox and the RF table at the beginning should be grouped by " =left(Sample_Name,len(Sample_Name)-2) & formatnumber(Sample_CalibrationLevel)"  Since this the the different std solutions with different cal levels will have a RF value, not just the last one. :)

Reply Children
No Data
Was this helpful?