Curve coefficient didn't correspond to the average.

Hi, 

First, I want to show how I perfomed my 1 level calibration curve. 

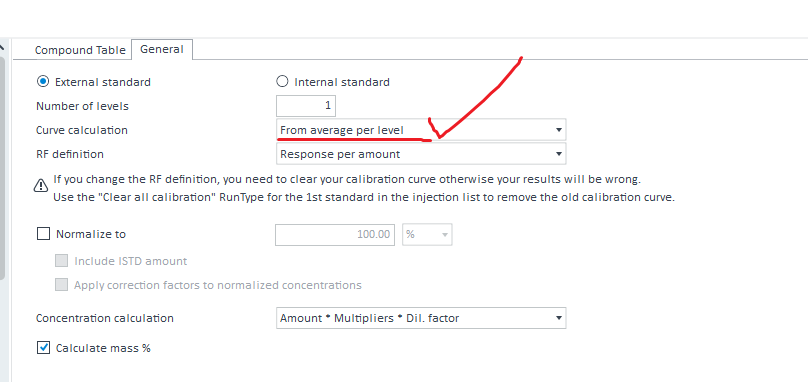
We saw that I asked for the average when several calibration standards are used and contained the same target compound. 

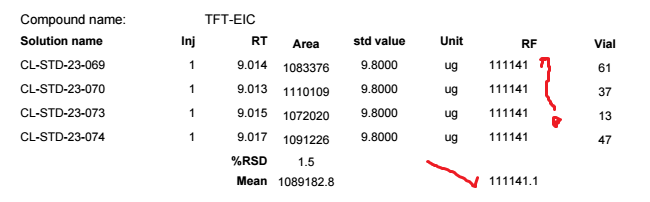
We do have the TFT in each of my 4 calibration standards. 

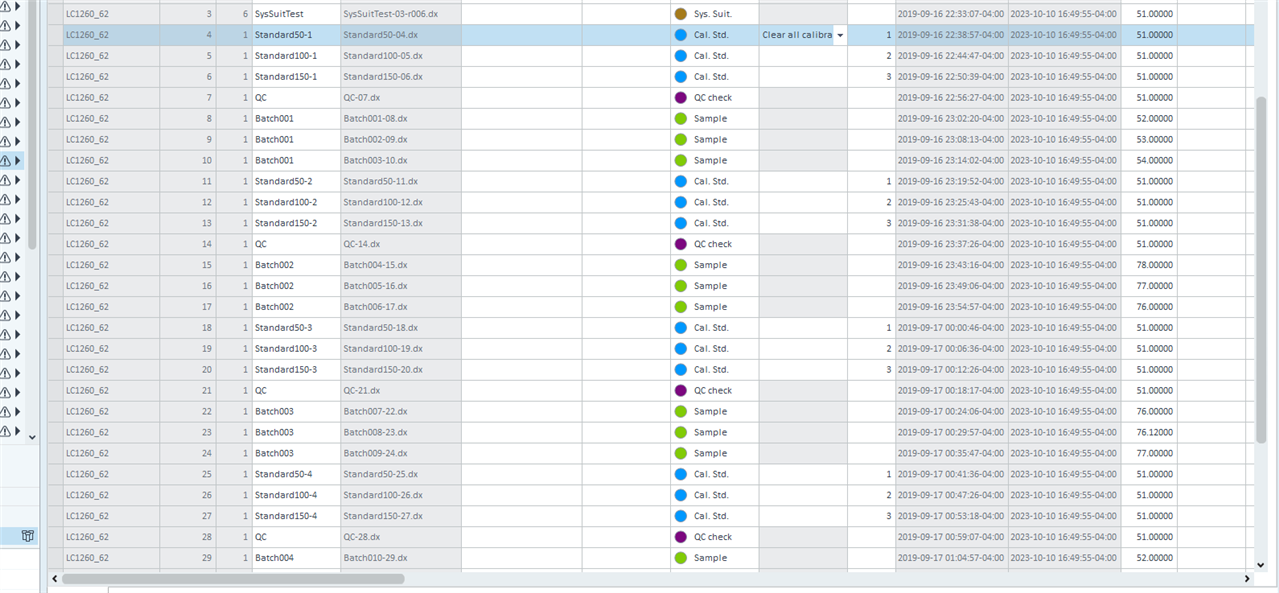
We can see it at my section filtered for Cal std only. 

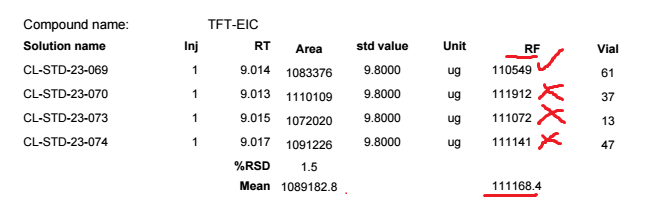
What's weird here it's the first RF calculated is good (1083376/9.8 = 110549) but all the other ones are wrong. 

If we take the 2nd one and did the same calculation (1110109/9.8= 113276) and the software gave 111912. 

I don't know where this 111912 result is coming from. 

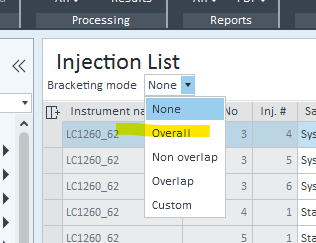
Here my injection list that shows how I performed my calibration.

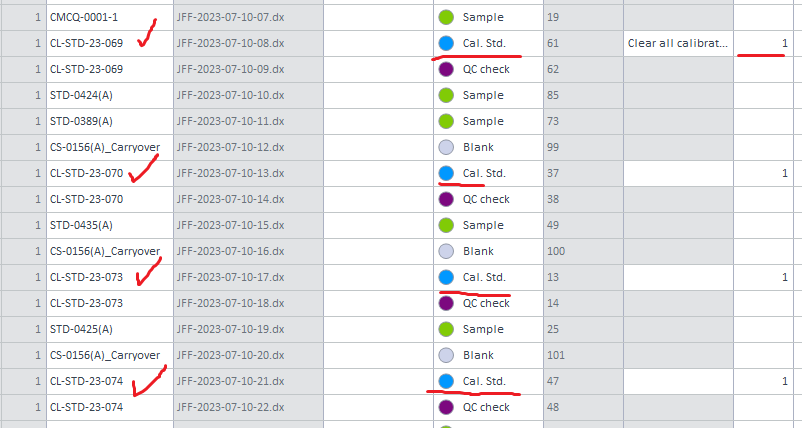
Is it because my Cal.Std are not injected one immediately after another? 

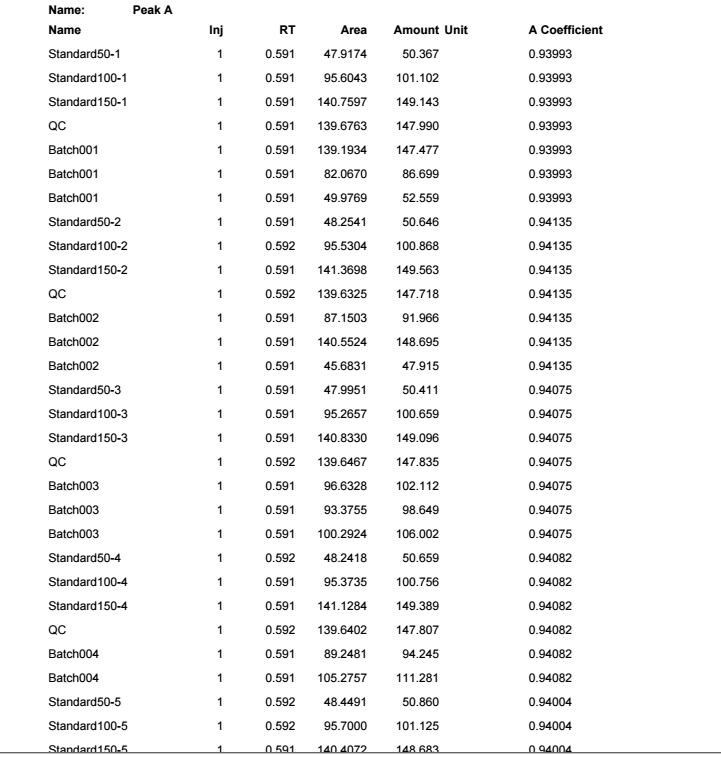
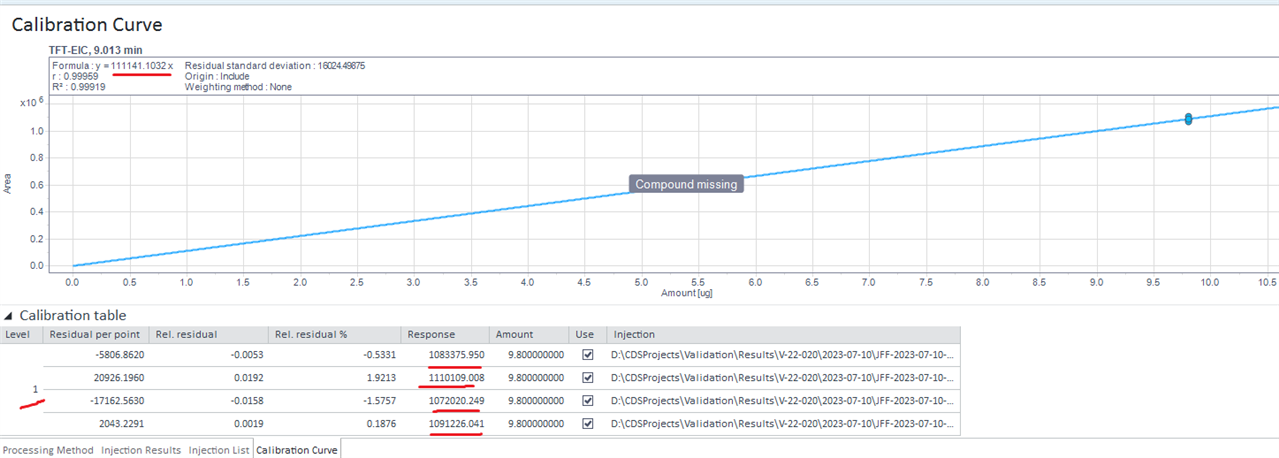
I can see on my calibration curve that I has four point but the coefficient a given in the table is coming from the first injection only and not the average like I choose on the method process. 

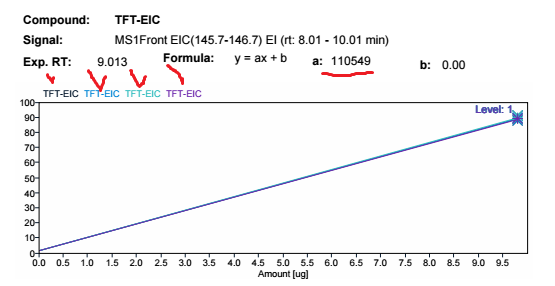
We can't see that the a coeffiecient on the curbe at 110549 is coming from the first injection. 

So it seems that the Curve calculation is not with the average of the four peaks.

Why ?

thank you


  • Hello,

    Which injection did you use to show in the report for the calibration curve? Look at your calibration curve in data analysis and see what the A value is for that curve. Also note the way you are calibrating every sample or sample pair has a different calibration. Look at the example below where I have discreet brackets for the standards but are processing in the standard manner. You will note the A coff changes after each standard set. In older versions, before CDS 2.5 the coff would have changed after each standard injection not each bracket. In this case bracket is defined as cal std injections with no other sample types between them. If you want all your standard injections taken into account for all other injection types, you should use the overall bracket. 

    Marty 

  • Hi Martin. Thank you again for your precious help. 

    By changing to the "overall" bracketing mode, I finally had an average response based on the 4 TFT peaks founds in my 4 standard solutions (Cal.Std)

    My only concern it's that I can't show single response factor to each injection. Do you know how to do that? 

    It seems that only the average is showed. 

    But at least now, I can see that for TFT, 4 peaks are averaged in the calibration curve

    Thank you again for your help. 

  • Hello,

    That RF is not what was used in the calibration but what was used to recalculate the compound amount for that injection from the calibration. If you need the RF for the single injection, you will need to calculate it from the compound calibration amount and the peak area, taking into account the RF definition in the method. IS methods make the calculation more difficult. CC is the easiest way to get the IS area and amount for a peak to do that calculation if needed. 

    CurrentInjection.AllIdentifiedPeaks.Where(function (x) x.Compound_Name = CurrentPeakOrGroup.Compound_UsedInternalStandard).Select(function(x) x.Peak_Area).Max

  • Hi Martin the IS in our procedure is not for calculations but only for RRT since the Forensic analysis ask for it. 

    I only want to show RF in the single injection instead of showing the average response factore coming from my 4 standard solution injections. 

  • If you want to show the RF of an individual injection, you can't use the calibration curve average RF, which is what it seems you are referencing. I'm not sure if there is already a preset field for the RF of an individual injection, but the calculation is fairly simple to do anyway. In the RF column value expression just put =Area/Amount (where Area here is either Peak_Area or Compound_AreaSum depending on your case and Amount here is probably Compound_CalibAmount)

  • OL's RF handling is terrible...  My solution: At the beginning of the report, i've created a textbox, filtered for Cal type only. Value=max(Sample_AcquisitionOrderNo), saved this as STDLastRow  variable. Then there is a compound table, filtered by STDlastrow, where the RF values are displayed & stored in an array(like RepRF). For unique key value the compound_name was given. If everything is ok, you can display the correct RF value at every page with =RepRF(Compound_Name). Next issue: for missing peaks, there are no RFs. Hate this... So create a textbox, group it by compound_name. filter : " =IIF( Double.IsNaN( Code.DVL.GetValue(Compound_Name & "RepRF")), 1, 0)    =   0 That's it. Place this group where you want, every compound's RF will be there.

Was this helpful?