Error default values for the Compound summary table

Hi, 

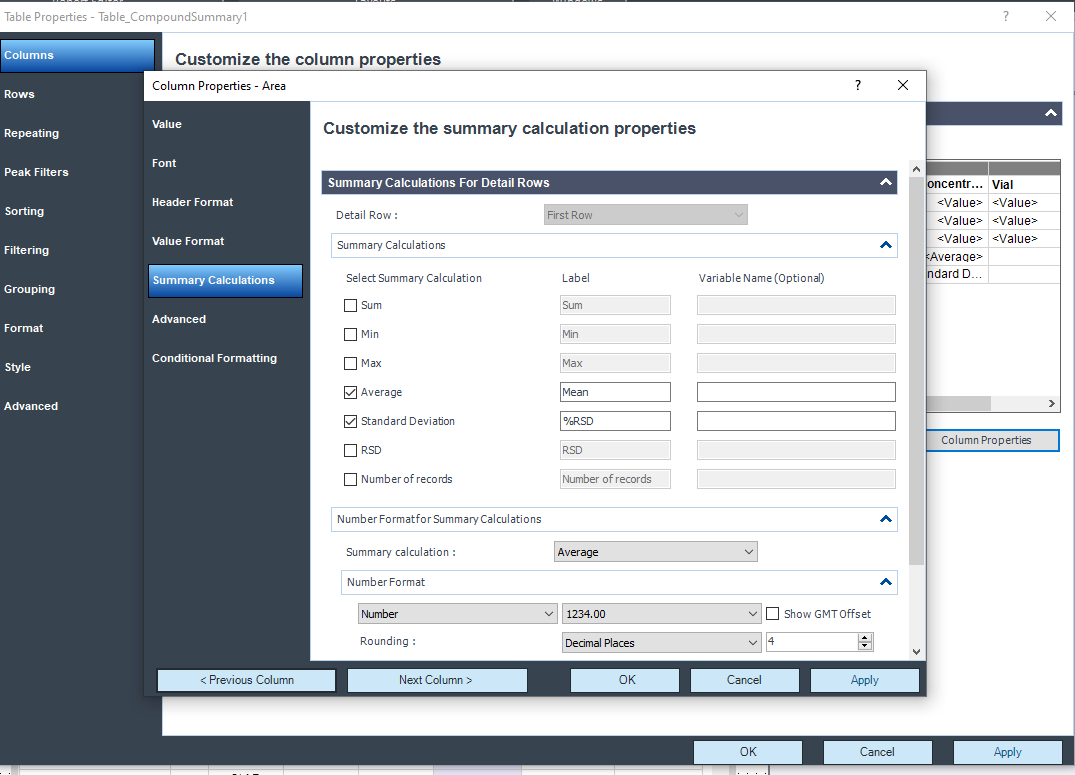
I try to use the Compound summary table and by default agilent put those values for % RSD and average:
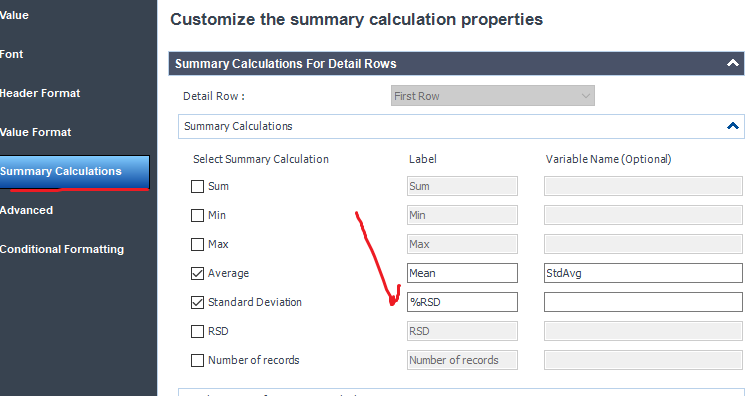
But I found that the label % RSD is incorrect at the Standard Deviation. It gives way too high %. 
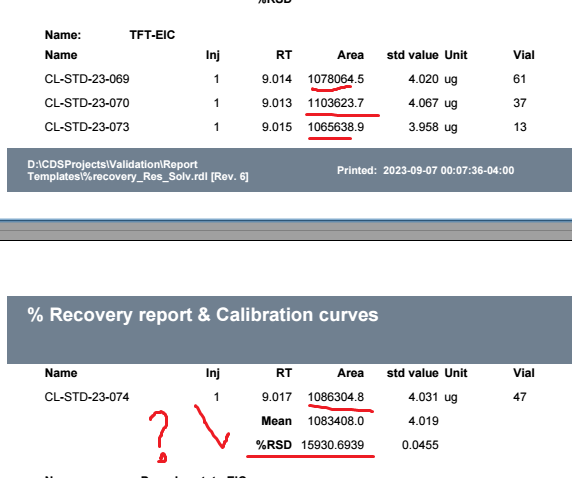
when I do the calculation on Excel % RSD is in fact the standard deviation. 

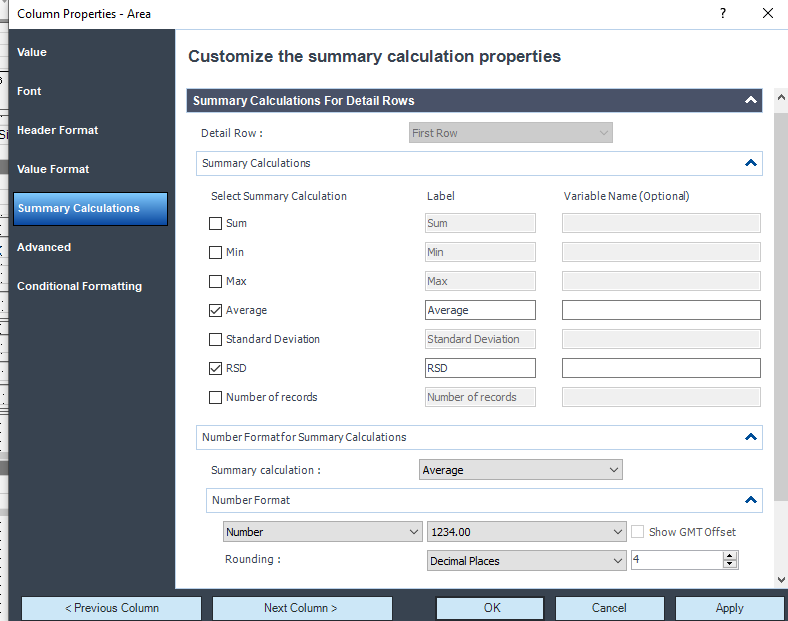
So I changed for RSD and it's ok. 

I have no idea why they have this label so confusing and wrong. 

Maybe it's fixed when the 2.7 version. 

Parents
  • Hello,

    It seems to be an error with that table configuration. The check mark is the important selection for the calculation, the label is just a text label. It seems the other table objects have the correct default labels. 

    Marty

    Compound Summary

    Peak Results 

  • Yeah I choose the good row RSD and it is working well. I don't why we have the default row from a default Agilent table wrong. 

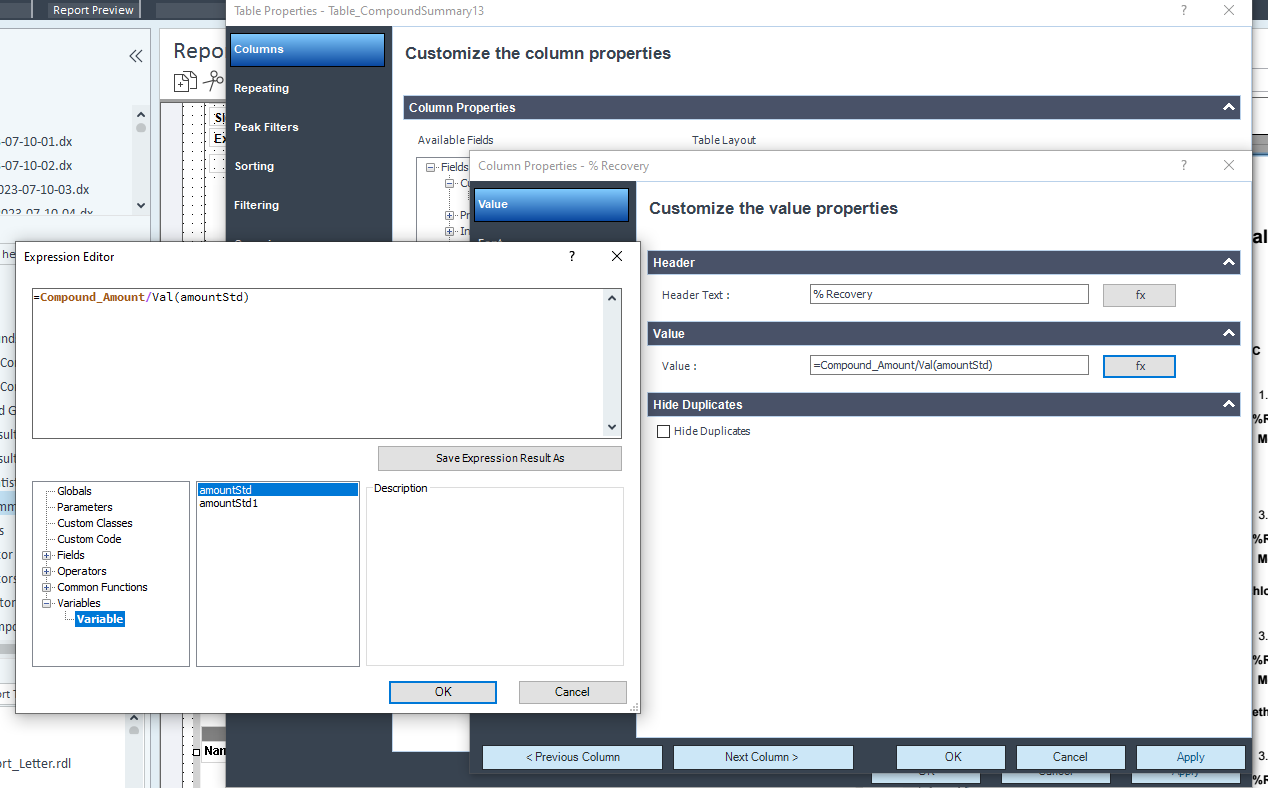
    I also tried to calculate % recovery as your colleague Richard showed in this quick video.

    Calculate Percent Recovery of Samples in OpenLab CDS (3931628) (on24.com)

    But I have a infinite value. Richard said it might be the way the variable was set. But I did exactly as he told. 

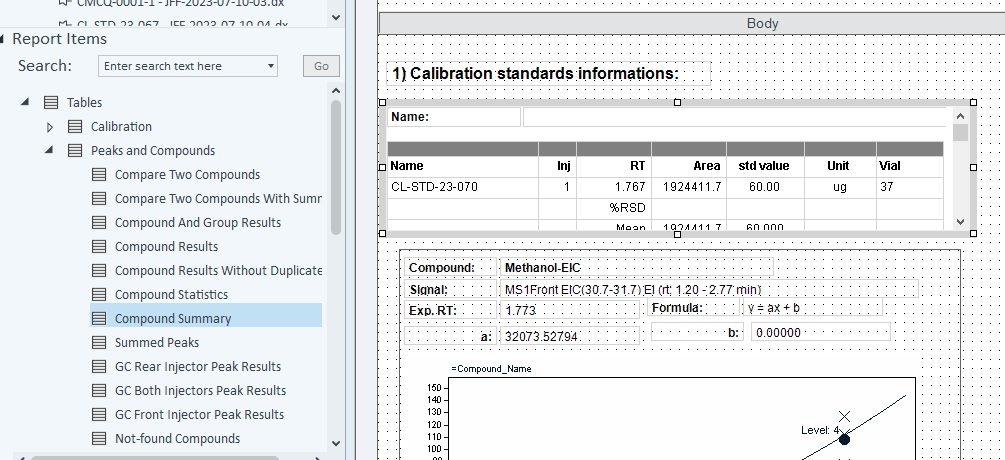
    I tried to do it as sample type 4 (control). Here an example with Methanol-EIC. We can see that the value calculated from this QC with the Cal is okay. But when I tried to divided by the the mean value enter the the Cal level, we have infinite value. 

    I can send you the email exchange with Richard this morning. 

    I can send it to William Cody, if you don't want to share your email here. 

    Thank you for your help. 

  • Hello,

    How are you entering the value for the recovery? Is this a rerun of a standard level or are you entering the information as a compound custom field? The infinity means you are dividing by 0, so I would assume one of your values in the expression is 0. If you are using a custom field t could be that your value is text not a number to resolve that put it inside a Val() function. I could not open the video for some reason. 

    Marty

  • I can send the video by email if you want. But I did exactly as Richard said on his video. I first create a new sequence summary report template as he asked in the video. I also used the  Compound Summary table as report item to start. 

    I put filter sample type =1 (Cal.Std) and also filtered by compound name that contains EIC. 

    It has default sorting that I don't know how to manage it. Do I need to delete those sorting? 

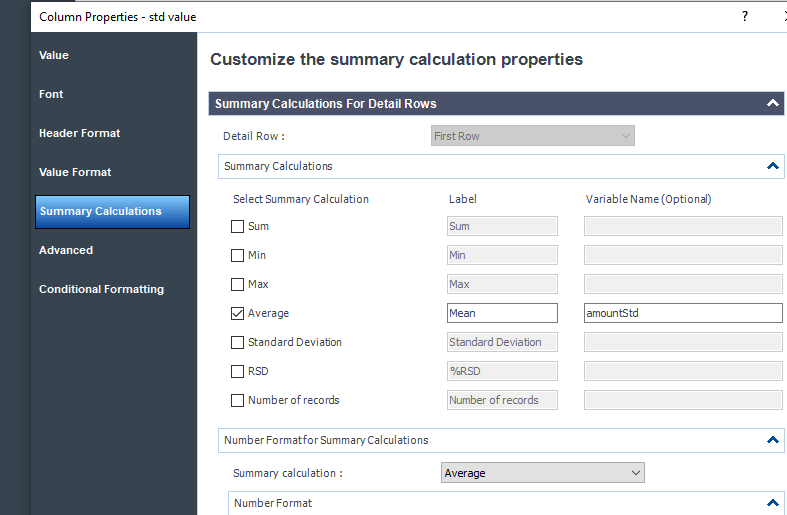
    So after that I went to the amount column properties and click on the average to put a variable. 

    After, like Richard showed in the video, I copy this exact table and I only change the sample type 1 for sample type 4 so I can calculate the recovery on the amount calculated by the 1 point curve. 

    I added a column custom field column to add the % recovery calculation. 

    And I see infinite as a result. 

    What's wrong? 

  • I did this filter to focus only on methanol-EIC and it works. Now the recovery makes sense at 100.3%

    I did choose the sequence summary report template in order to do average, % RSD. 

    But How can I have the table of all the calibration std level 1 of each 65 compounds sorting by retention time with their respective calibration curve after their own table. 

    I will group this feature as Calibration information. 

    The next table will not have curve, but only the recovery of QC (sample type 4) sorting also as retention time. 

    Thank you for your help. 

Reply
  • I did this filter to focus only on methanol-EIC and it works. Now the recovery makes sense at 100.3%

    I did choose the sequence summary report template in order to do average, % RSD. 

    But How can I have the table of all the calibration std level 1 of each 65 compounds sorting by retention time with their respective calibration curve after their own table. 

    I will group this feature as Calibration information. 

    The next table will not have curve, but only the recovery of QC (sample type 4) sorting also as retention time. 

    Thank you for your help. 

Children
  • Hello,

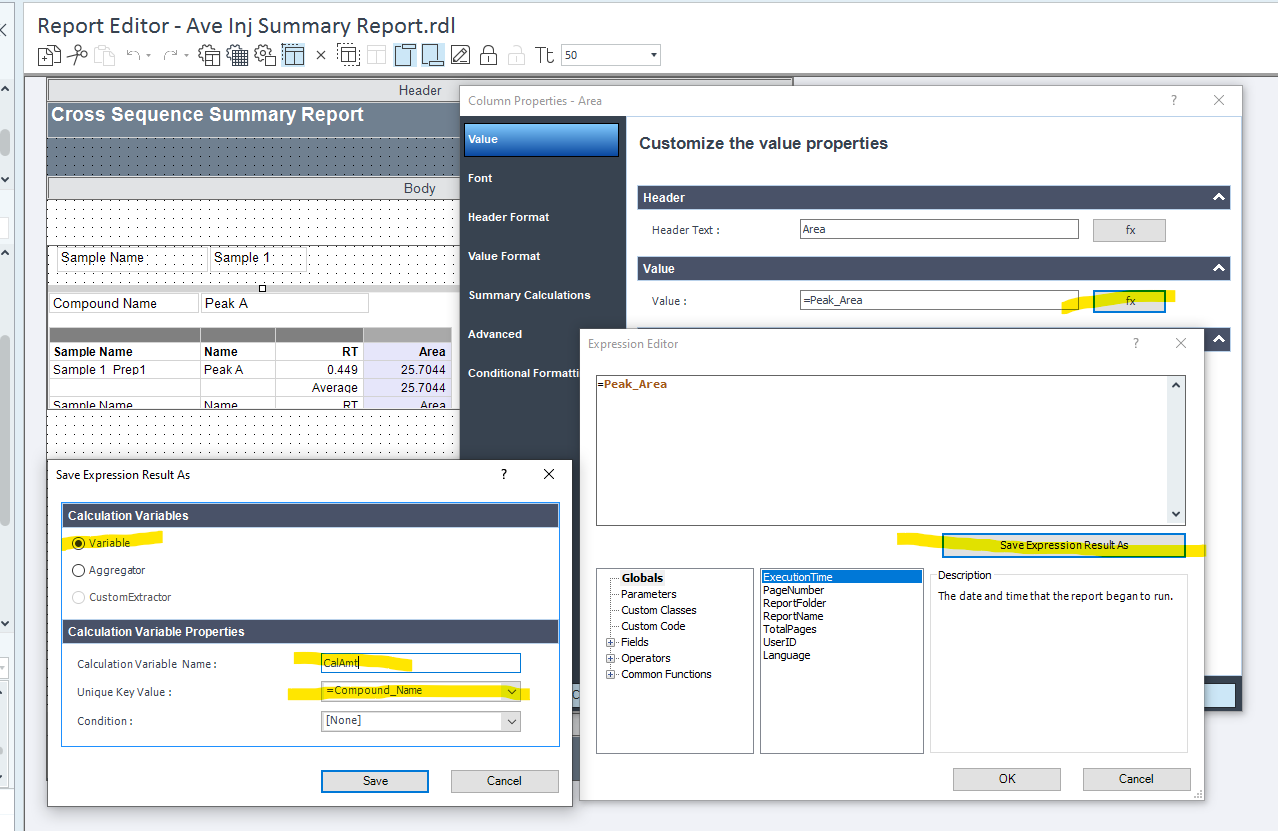
    You cannot store more than one value in that variable in the way you created it. That is the main disadvantage creating variables from the table summary calculations and why I never use them in reports except for display. Unless you group repeat together on compound name, both the table where you stored that value and the table where you use that value, that approach will not work. I would instead go to that column in the first table and store the value as a variable indexed on compound name. Creating it in that way means you have stored an array of values based on the compound name. When your table rows below change compound the corresponding value from that array will be used. In the example below, I am storing peak area but for you it will be that value of the std value column.

    Marty

Was this helpful?