Error default values for the Compound summary table

Hi, 

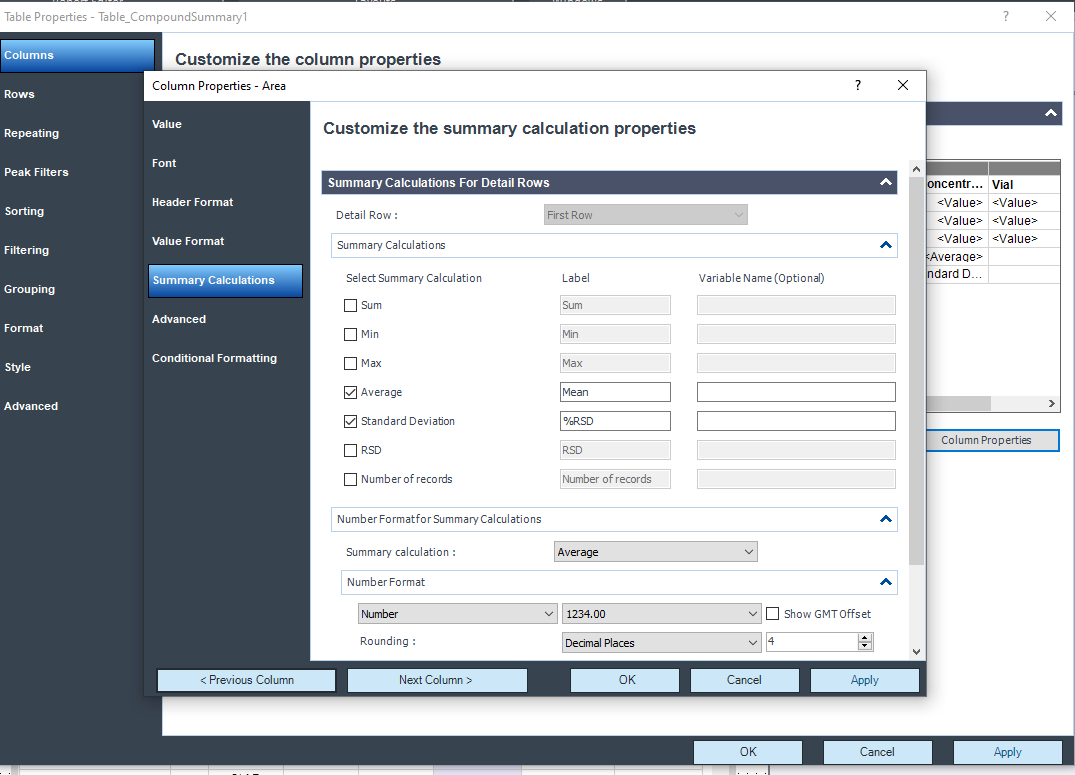
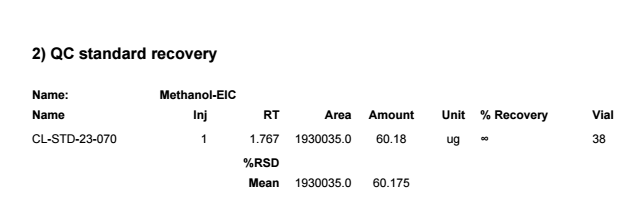
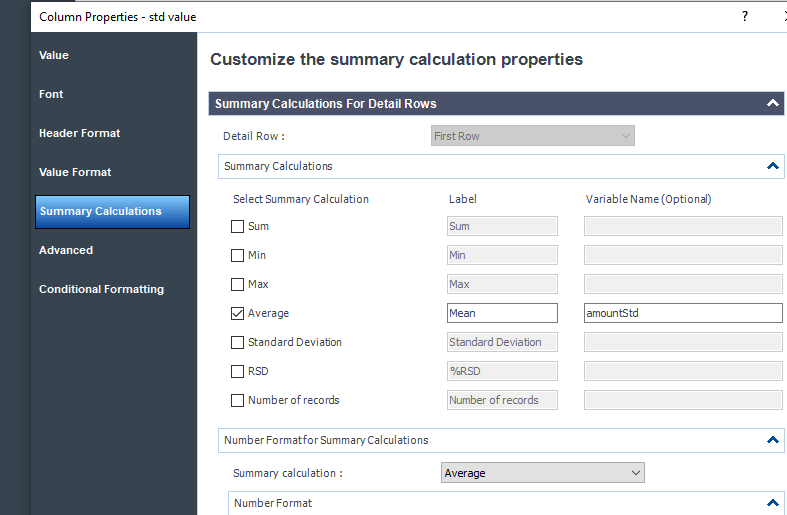
I try to use the Compound summary table and by default agilent put those values for % RSD and average:

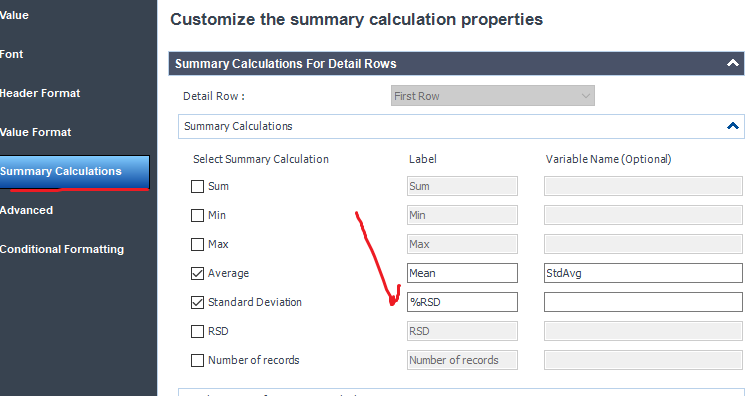
But I found that the label % RSD is incorrect at the Standard Deviation. It gives way too high %. 

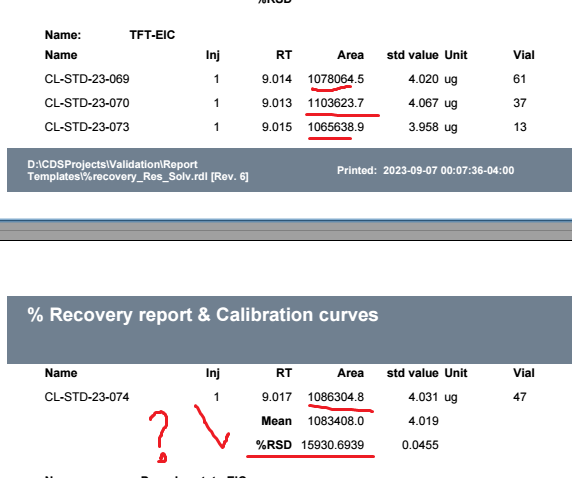
when I do the calculation on Excel % RSD is in fact the standard deviation. 

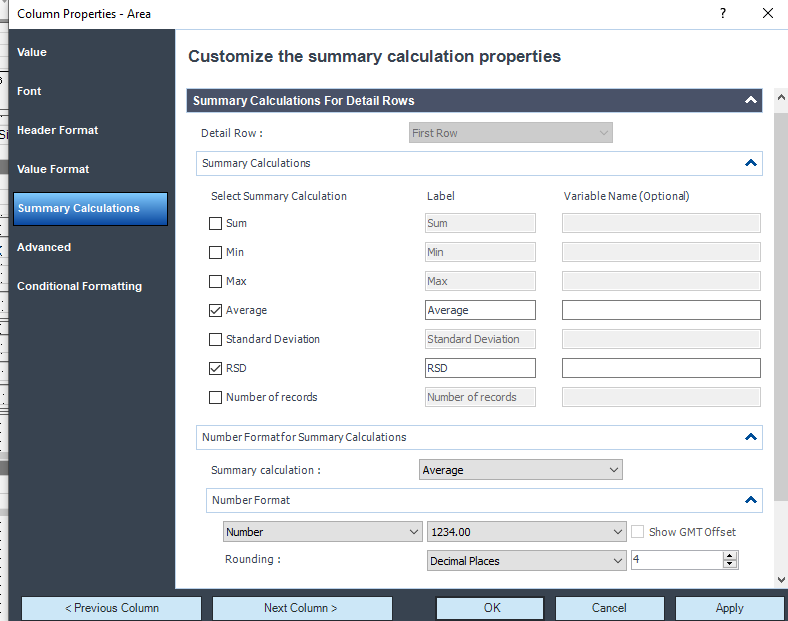
So I changed for RSD and it's ok. 

I have no idea why they have this label so confusing and wrong. 

Maybe it's fixed when the 2.7 version. 

Parents
  • Hello,

    It seems to be an error with that table configuration. The check mark is the important selection for the calculation, the label is just a text label. It seems the other table objects have the correct default labels. 

    Marty

    Compound Summary

    Peak Results 

  • Yeah I choose the good row RSD and it is working well. I don't why we have the default row from a default Agilent table wrong. 

    I also tried to calculate % recovery as your colleague Richard showed in this quick video.

    Calculate Percent Recovery of Samples in OpenLab CDS (3931628) (on24.com)

    But I have a infinite value. Richard said it might be the way the variable was set. But I did exactly as he told. 

    I tried to do it as sample type 4 (control). Here an example with Methanol-EIC. We can see that the value calculated from this QC with the Cal is okay. But when I tried to divided by the the mean value enter the the Cal level, we have infinite value. 

    I can send you the email exchange with Richard this morning. 

    I can send it to William Cody, if you don't want to share your email here. 

    Thank you for your help. 

  • Hello,

    How are you entering the value for the recovery? Is this a rerun of a standard level or are you entering the information as a compound custom field? The infinity means you are dividing by 0, so I would assume one of your values in the expression is 0. If you are using a custom field t could be that your value is text not a number to resolve that put it inside a Val() function. I could not open the video for some reason. 

    Marty

  • I can send the video by email if you want. But I did exactly as Richard said on his video. I first create a new sequence summary report template as he asked in the video. I also used the  Compound Summary table as report item to start. 

    I put filter sample type =1 (Cal.Std) and also filtered by compound name that contains EIC. 

    It has default sorting that I don't know how to manage it. Do I need to delete those sorting? 

    So after that I went to the amount column properties and click on the average to put a variable. 

    After, like Richard showed in the video, I copy this exact table and I only change the sample type 1 for sample type 4 so I can calculate the recovery on the amount calculated by the 1 point curve. 

    I added a column custom field column to add the % recovery calculation. 

    And I see infinite as a result. 

    What's wrong? 

Reply
  • I can send the video by email if you want. But I did exactly as Richard said on his video. I first create a new sequence summary report template as he asked in the video. I also used the  Compound Summary table as report item to start. 

    I put filter sample type =1 (Cal.Std) and also filtered by compound name that contains EIC. 

    It has default sorting that I don't know how to manage it. Do I need to delete those sorting? 

    So after that I went to the amount column properties and click on the average to put a variable. 

    After, like Richard showed in the video, I copy this exact table and I only change the sample type 1 for sample type 4 so I can calculate the recovery on the amount calculated by the 1 point curve. 

    I added a column custom field column to add the % recovery calculation. 

    And I see infinite as a result. 

    What's wrong? 

Children
No Data
Was this helpful?