Summarization table in report

Hello,

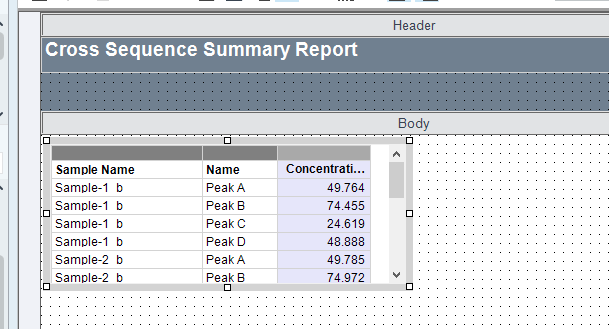
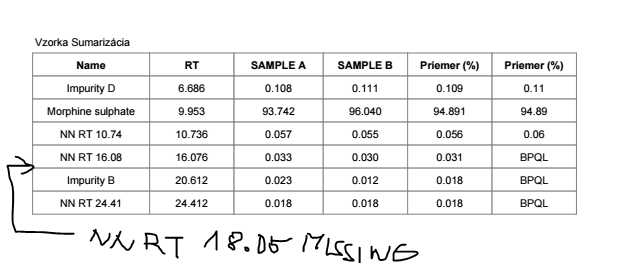
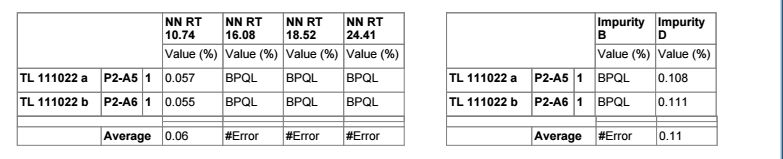
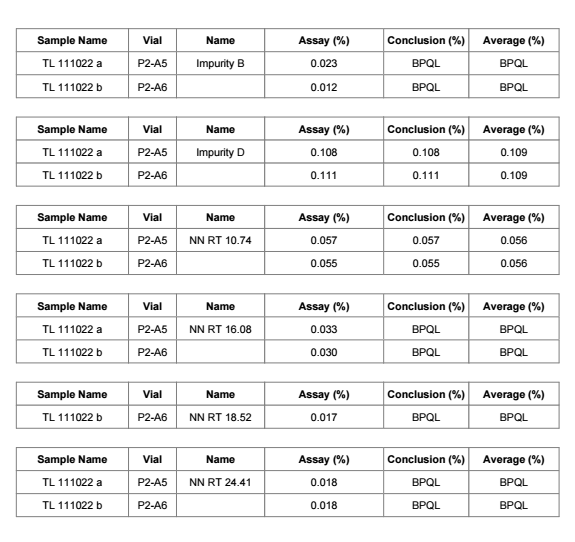
We were trying to create a summarization table at the end of the report. The table that you can see on the screenshot below is created from matrix. BPQL means that the value is lower than 0.045 but OpenLab can’t calculate the average from “text values” so the average value is Error in case of BPQL partial results. Is there any way how to put BPQL into the average row or can we hide the “Error” expression in that table (matrix)?


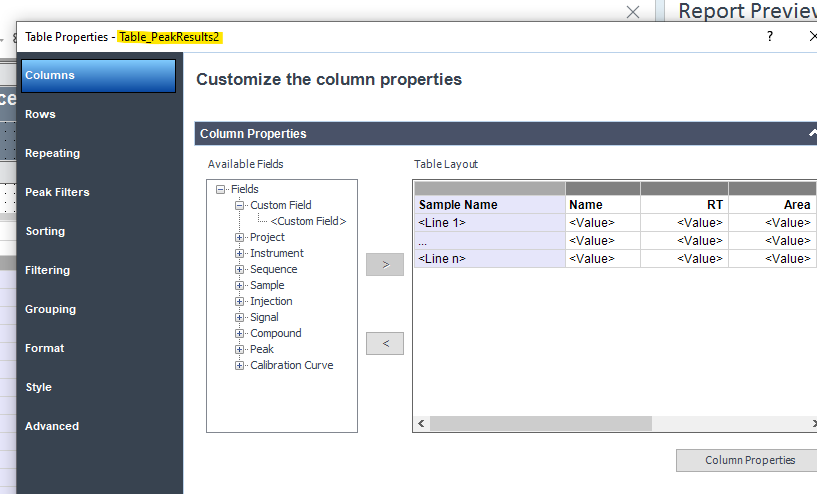
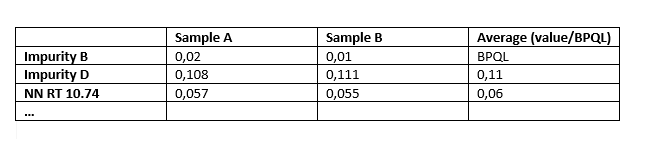
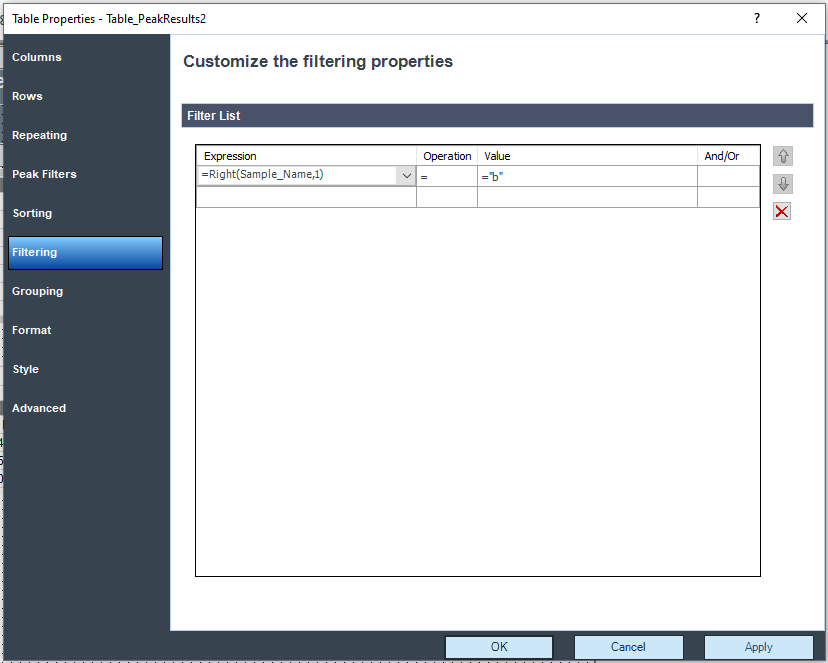
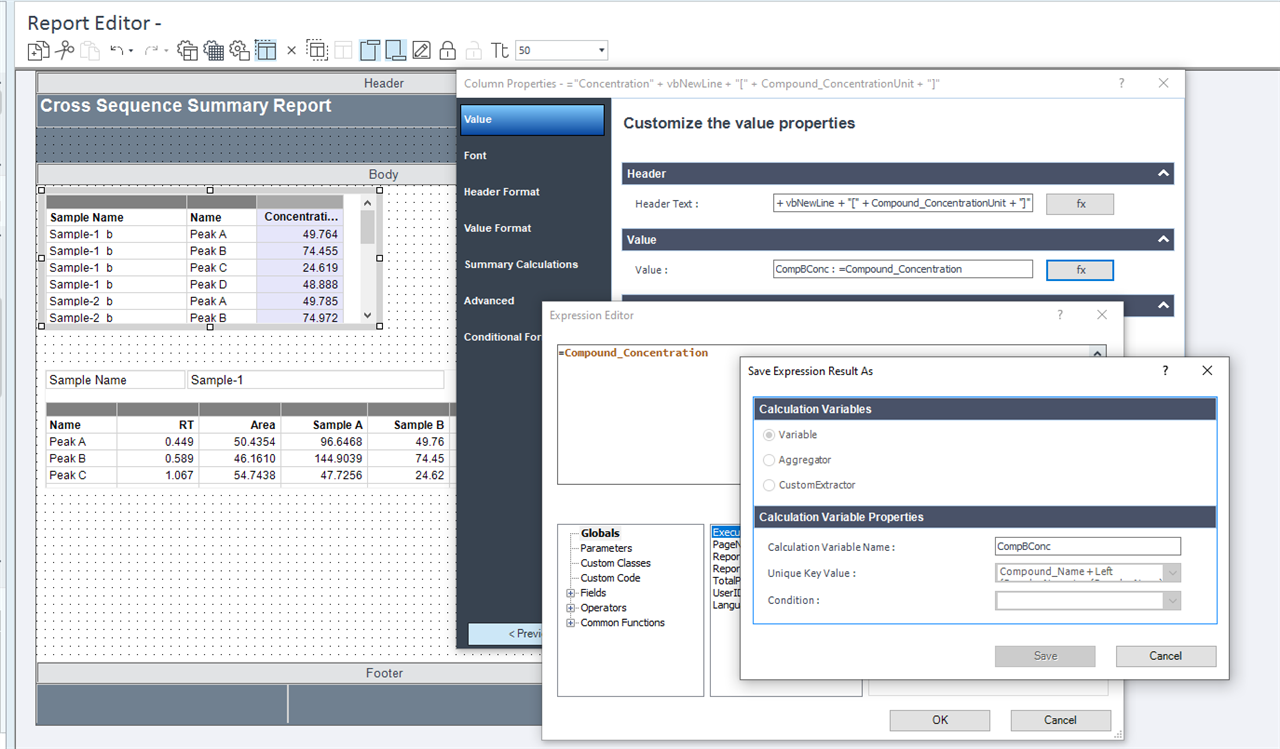
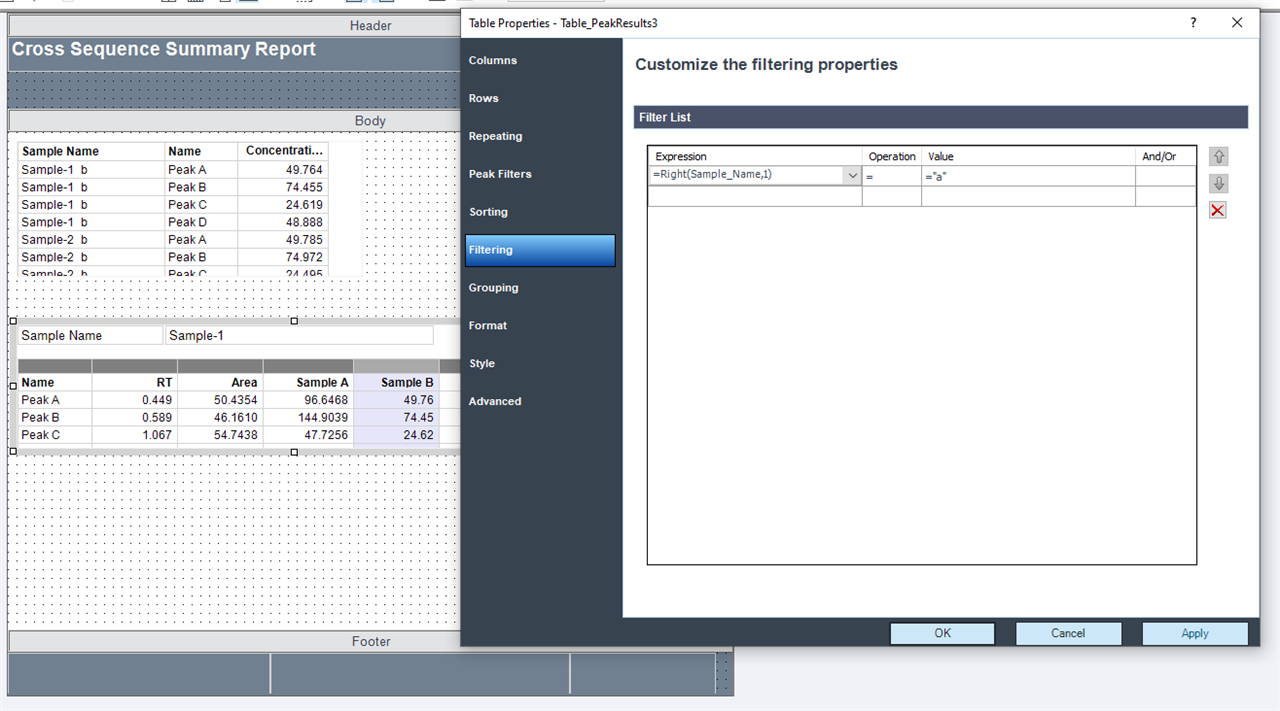
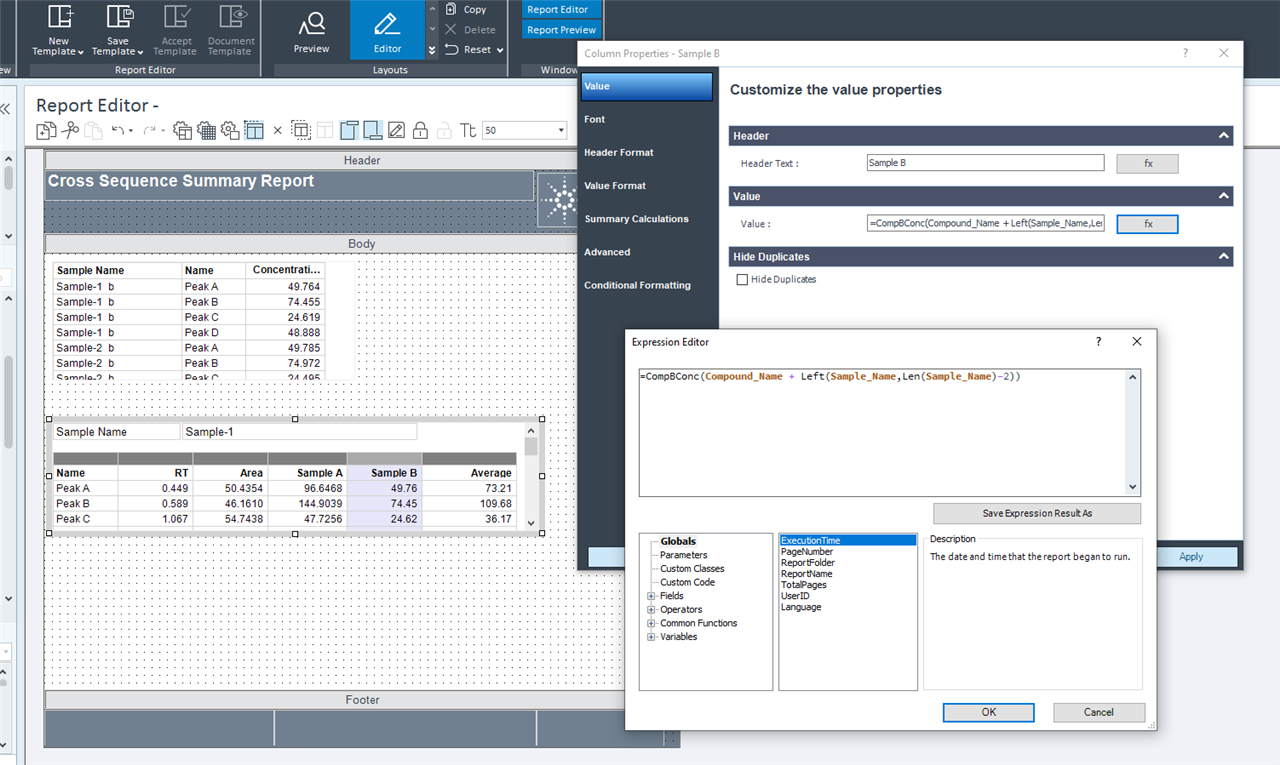
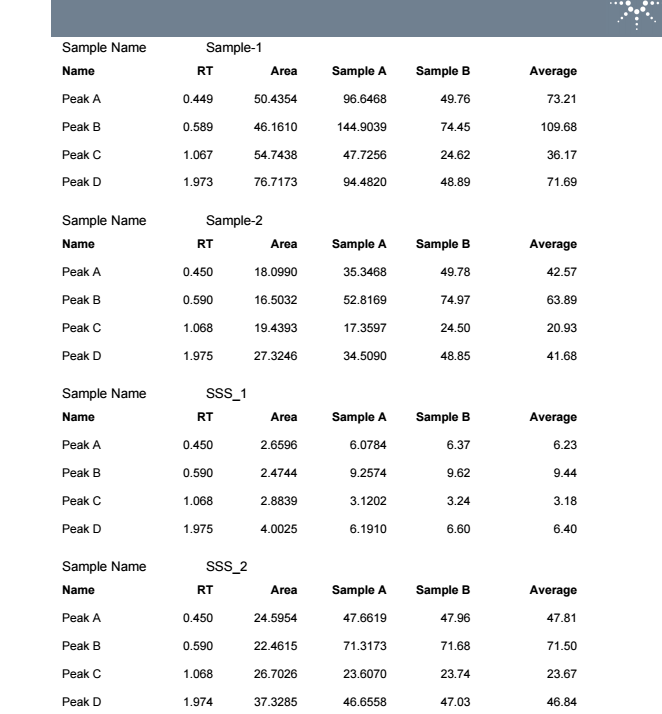
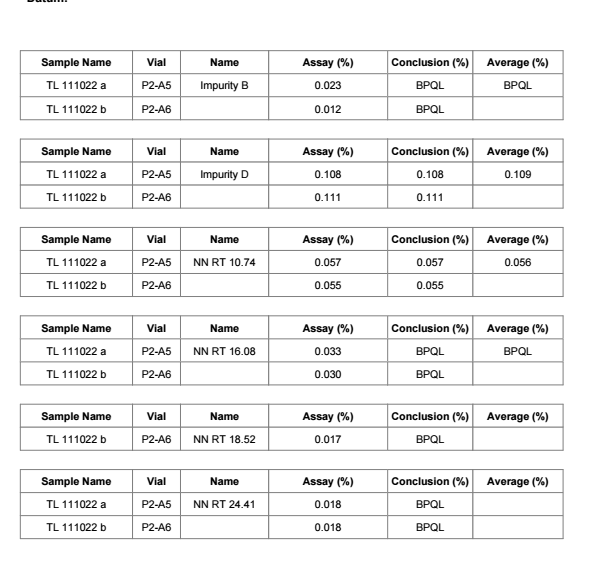
On another screenshot, you can see other try for creation of summarization table. Table is form from Compound result table so it’s more flexible than matrix. For calculating the average, we’re currently using aggregator from hidden table. In this case I just want to ask if it’s possible to get only one result value in average column. Now as you can see in average column, we get the same final results for every impurity. When we hide duplicates, it hides same expression/numbers in that column not just in row. Is there any way how to merge cells for single compound (impurity) in average column to get only one final result (BPQL or number)?


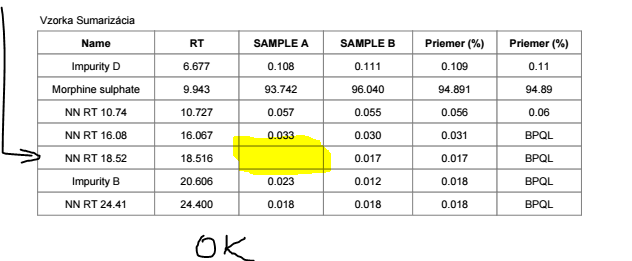
Here you can see the table with hidden duplicates in average column.

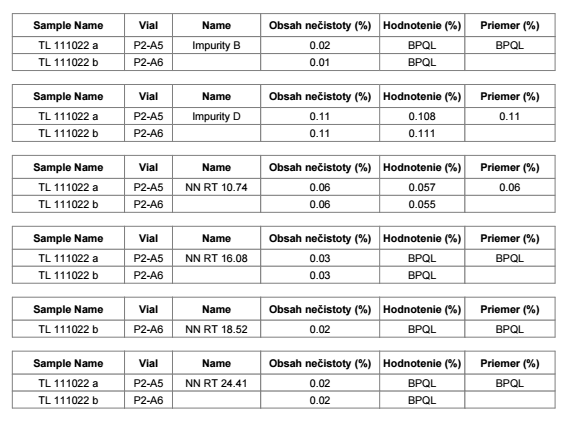
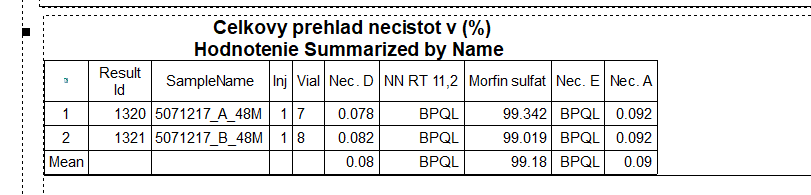
At last we attach the summarization table from EMPOWER. Our goal is to create the same or very similar summarization table in OpenLab. We hope that it is possible Relaxed We are currently using OpenLab 

Thank you very much for your answers.

Parents
  • Hello,

    You cannot alter the matrix or table summary calculations, as those are coded into the object. In the table example, you could use an expression like =IF(RowNumber("OLIR_Table_PeakResults2") = 1,FormatNumber(Peak_RetentionTime,3),"") in your Average % column. Where I have Peak_RetentionTime in the true part of the if, you would replace with your current expression. Also, you would need to replace "OLIR_Table_PeakResults2" with "OLIR_yourtablename" in the expression. You can find the exact table name in the object properties.

    Marty Adams

Reply
  • Hello,

    You cannot alter the matrix or table summary calculations, as those are coded into the object. In the table example, you could use an expression like =IF(RowNumber("OLIR_Table_PeakResults2") = 1,FormatNumber(Peak_RetentionTime,3),"") in your Average % column. Where I have Peak_RetentionTime in the true part of the if, you would replace with your current expression. Also, you would need to replace "OLIR_Table_PeakResults2" with "OLIR_yourtablename" in the expression. You can find the exact table name in the object properties.

    Marty Adams

Children
  • Thank you for your answer Marty, definitely going to try it. Will let you know how it works.

  • Hello Marty,

    first of all, thank you very much for your advice (as you can see on the screenshot below, it works perfectly).

    Now I have one more question for you. Is it possible, to create a table, which will look like that one on screenshot (the example of table, which we want is created in word for now)?

    Once more time thank you for your reply, it help a lot.

    Looking forward for your next answer.

    Thank you.

  • Hello,

    You can do it, but the solution requires hidden tables and stored variables. I setup a hidden table at the top filtered for only the b samples. In that table, under the concentration field, I store the concentration value as a keyed variable using Compound_Name + Left(Sample_Name,Len(Sample_Name)-2) as the key. This allows me to store a value for b for the sample name where it matches between a and b. In the table for display, I filter it to only show the a samples and the add the stored value for b to a column in the table. One note is older versions did not allow expression-based keys for variables so if find any issue with storing that value try an index aggregator instead. Also you should repeat the displayed table on the same expression as I used for the variable index. 

    Marty Adams

  • Hello Marty,

    Thank you for your advices, I really appreciated it. We tried your latest suggestion and it works almost perfectly. We found just one issue. In the SAMPLE A we have one impurity, which is not detected, but this impurity is detected in SAMPLE B, so when we create a display table for SAMPLE A and we import stored values for SAMPLE B, as you suggest, this impurity is not shown in peak results table (as you can see on the picture below).


    In case of that we create a display table for SAMPLE B and we import stored values for SAMPLE A, we can see the impurity NN RT 18,52 in the table (picture below).


    I completely understand that, the peak result table for SAMPLE A can’t show the undetected impurities but despite of that I just want to ask you if there is any way how to fix it, or this is the only one. SAMPLE A and SAMPLE B in this example are parallel samples, so it is the same sample but in SAMPLE A (injection 1) the impurity NN RT 18,52 was evaluated as not detected and in case of SAMPLE B (injection 2) there is detected a little amount of this impurity. In case of some future measurements we will not exactly know, which impurity will be detected and which not, so we want to create some “resistant” report. We are trying to create some kind of automatic report, without any unnecessary intervention from laboratory assistants.


    Thank you very much for all advices and really appreciated your time.

  • Hello,

    Did you have the display table setup to show missing peaks?

    Marty Adams

  • Hello Marty,

    as all of your advices also this one works perfectly. I tried what you recommend before I asked you, but when I set to show missing peaks, table remains the same in the report editor – I forgot to refresh report preview.

    Thank you for your time and advices, really appreciated it. We learn something new thanks to you, and the most important thing, we have some kind of summarization table in report now.


    Thank you very much and wish you all the best.

Was this helpful?