Dear Mrs/Mr,
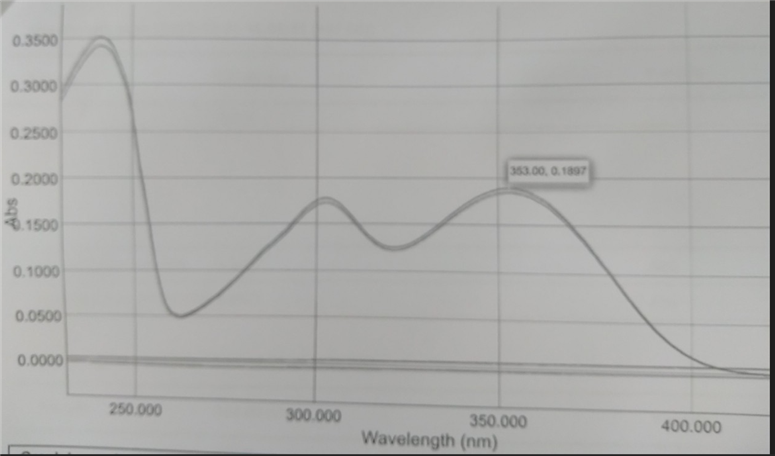
I'm from Vietnam and I'm working for a pharmaceutical company. We have an UV-vis Cary 3500 system in our lab. Please help me, how can I find peaks and label more than one peak in one spectrum?
I did it but it didn't work automatically. We have to find peaks manually. I wonder that this function "find peaks automatically" is available in the software or we have to pay more for it.
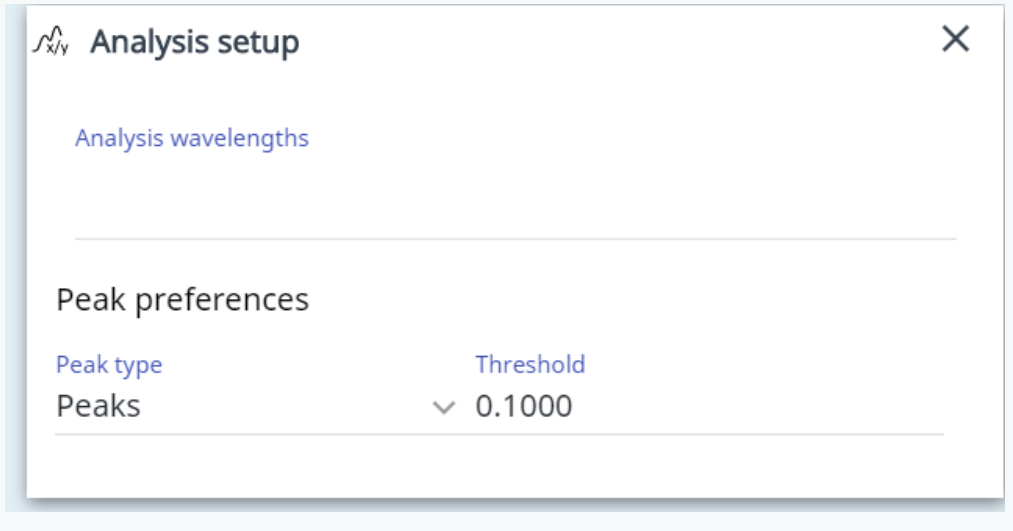
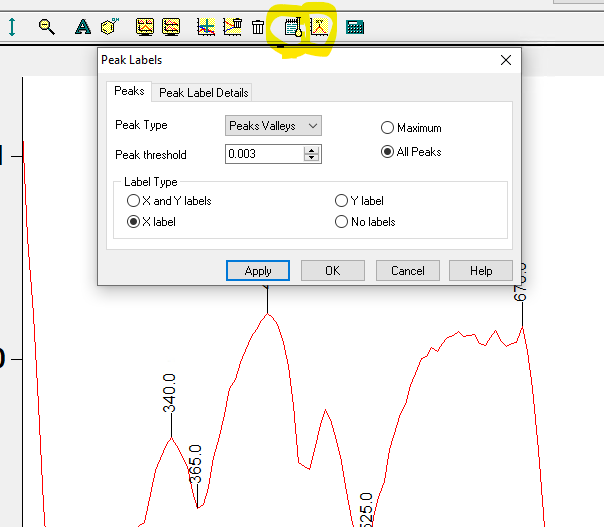
Hi MinhThu, I'm following this. We can lower the threshold to find several peaks, but this is not convenient for all our products to play around with the exact threshold and revise the scan method each time. The analysts can use the graphics function and label the peaks and valleys at the end of the run. It's immediately apparent to your eyes when you see, say the highest three peaks and the lowest three valleys. We have the same issue with moving from ChemStation to WinUV. Hope this helps. Let this message board know if you find a better way of automating Peak/Valley Annotation.
Hi MinhThu, I'm following this. We can lower the threshold to find several peaks, but this is not convenient for all our products to play around with the exact threshold and revise the scan method each time. The analysts can use the graphics function and label the peaks and valleys at the end of the run. It's immediately apparent to your eyes when you see, say the highest three peaks and the lowest three valleys. We have the same issue with moving from ChemStation to WinUV. Hope this helps. Let this message board know if you find a better way of automating Peak/Valley Annotation.
Hi Sabbas, thank you for your answer. I'm sorry I couldn't have answered you sooner.
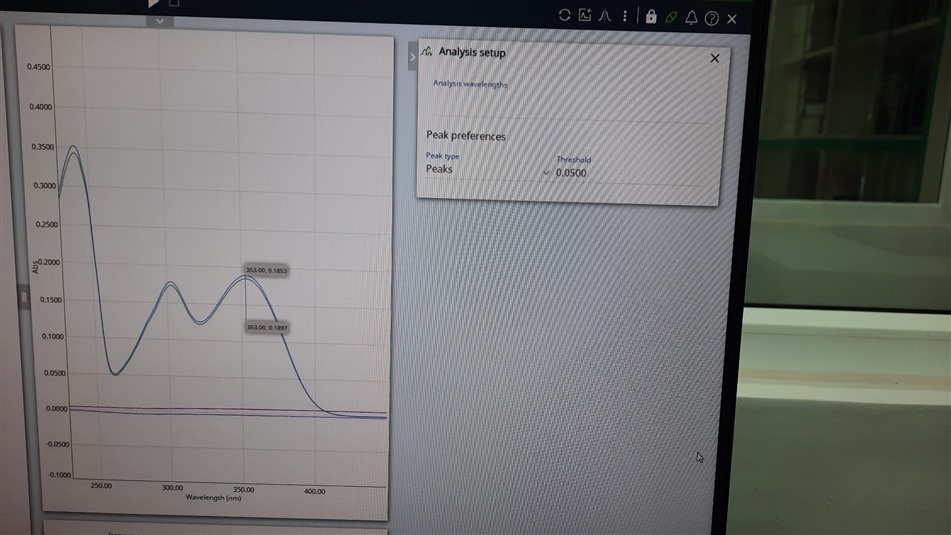
We're using Cary 3500 with Cary UV workstation version 1.3.5, so we couldn't perform like you said. We have to lower the threshold to find peaks and it is quite inconvenient.
We are glad this was helpful! We are sorry this was not helpful. If you still need assistance please create a community post or contact support. To help us improve, please provide any additional feedback.
For full details of how we will treat your information, please view our privacy policy.