I am completely new to Report Builder for developing report templates, but have worked a little bit in OpenLab on templates. I switched jobs and even the application is different, so I anticipate having to ask a bunch of questions to get this template to where I need it to be. I've read the Familiarization Guide and I've watched as many videos and read as much as I have been able to find. To start, this seemed like a basic thing to be able to do; so I was surprised I could not figure it out.
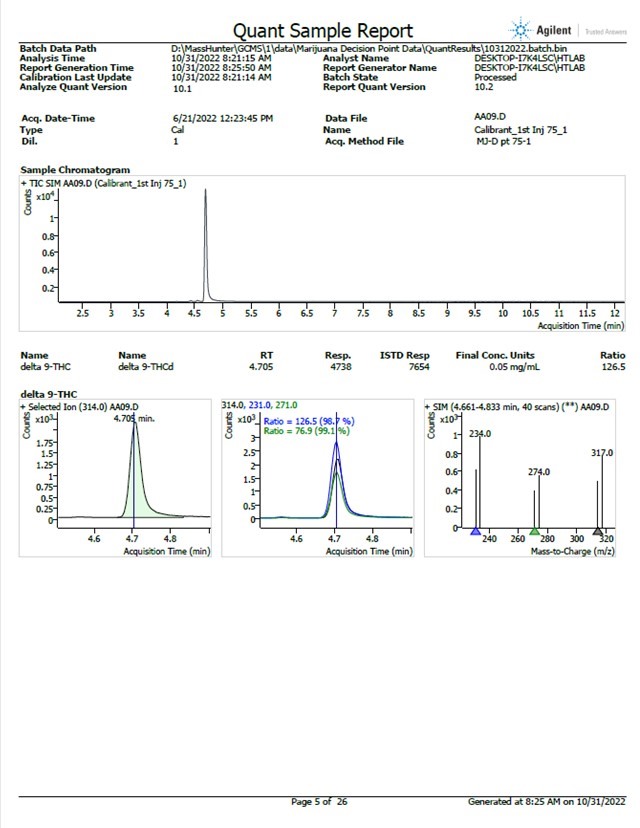
My assay is a semi-quantitative decision point for THC. Acquisition was in SIM mode. The shipping template I've chosen to customize is: Gen_Complete_ISTD
This template displays quantifier ion 314 and the qualifier ions 231 and 271. I want it to also display the ISTD quantifier ion 317 and qualifier ions 234 and 274. See attached page.
I can't figure out how nor was I able to find anywhere online how you add graphics to the template. Thanks for any help!

