Using Quant, how do I average properties like RT, area, and ion ratio?

Setup: I have a 1260 with auto sampler feeding a 6495 using 7.0 for acquisition and data analysis.

Goal: Average properties like RT, Area, and ion ratio for successive injections using Quantitative Analysis.

Example: From the following injection sequence, I'd like to calculate the average and standard deviation of the RT, peak area response, and ion ratio between my target and qualifier ions for the Precision and Low/Med/High Accuracy sample groups. I can do this with Excel by exporting a CSV but I'd rather set up a Quant method and PDF reporting to perform this to minimize the amount of data interpretation.


How do I average properties of successive injections?


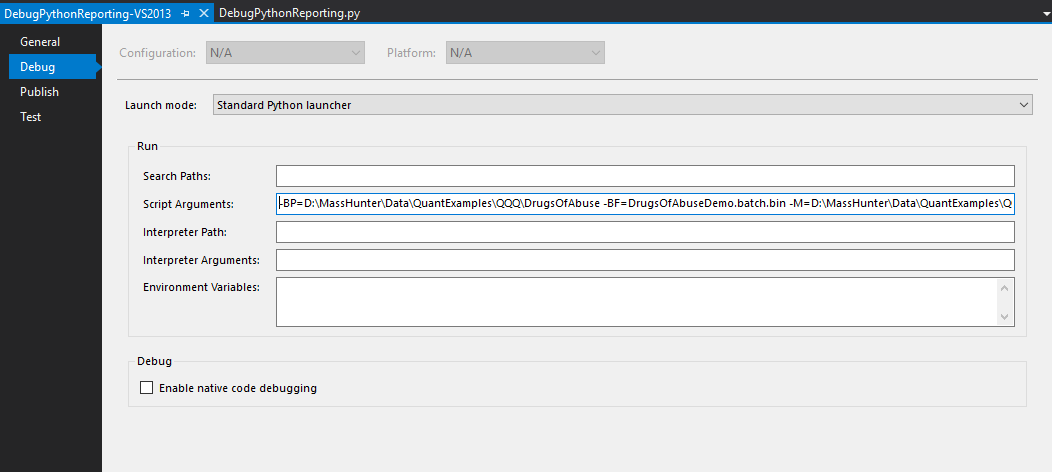
23 JUN 2020 Edit: It looks like there is the ability to run scripts and expressions as part of the report builder using Python for .NET; Are there any examples available of expressions or scripts that I can use to write my own? Nothing comes up immediately when I searched.

I did find the Report Builder Familiarization guide available here. Is there anything else describing the types of variables that are available or any sort of debugging environment?


InjectionDescription

Nominal

Concentration

Sample

Group

1

Blank

0Blanks
2Precision 1100Precision
3Precision 2100Precision
4Precision 3100Precision
5Precision 4100Precision
6Precision 5100Precision
7Precision 6100Precision
8Precision 7100Precision
9

Precision 8

100Precision
10Precision 9100Precision
11Blank0Blanks
12Accuracy 150Accuracy Low
13Accuracy 250Accuracy Low
14Accuracy 350Accuracy Low
15Blank0Blanks
16Accuracy 4100Accuracy Med
17Accuracy 5100Accuracy Med
18Accuracy 6100Accuracy Med
19Blank0Blanks
20Accuracy 7150Accuracy High
21Accuracy 8150Accuracy High
22Accuracy 9150Accuracy High
23Blank0Blanks
24Linearity 115Linearity
25

Linearity 2

30Linearity
26Linearity 345Linearity
27Linearity 460Linearity
28Linearity 575Linearity
29Linearity 690Linearity
30Linearity 7105Linearity
31Linearity 8120Linearity
32Linearity 9135Linearity
34Linearity 10150Linearity
35Blank0Blanks
  • I can confirm that the report will work in B.08.x and that all you need are the report template and the corresponding code file as mentions in his post.


    I can also confirm that RepositoryRevisionNumber did not exist in the B.08.x data set, so it is fine to comment that out or revert back to your original BatchInfo.py file.


    For the issues with report debugging, the path for the -BP flag should point to the directory that contains the results folder, not the results folder itself. What is probably making it really unhappy are the spaces in the path for your output folder. You could try putting that path in quotes but probably best to choose/create a simpler path name with no spaces. 


    I am able to successfully run the report debugging project with the following Script Arguments.

    -BP=D:\MassHunter\Data\QuantExamples\QQQ\DrugsOfAbuse -BF=DrugsOfAbuseDemo.batch.bin -M=D:\MassHunter\Data\QuantExamples\QQQ\DrugsOfAbuse\DOA_ReportMethod.m -OP=D:\MassHunter\Data\QuantExamples\QQQ\DrugsOfAbuse\QuantReports

    Script Arguments are entered in the Debug section under the Project properties dialog


  •  

    Updating from hypen to forward slash in the script argument fixed the issue; spaces are also bad/weird probably because of the way most .NET programs use CommandLineToArgvW. New Script Arguments reads as:

    /BatchPath=C:\temp\ /BatchFile=DrugsOfAbuseDemo.batch.bin /Method=C:\temp\test_method_please_ignore.m /OutputPath=C:\temp\report

    New error: 

    Error: Batch file 'DrugsOfAbuseDemo.batch.bin' does not exist
    Press any key to continue . . .

    The file is clearly there. Specifying full path for /BatchFile fixes this. New script argument reads as:

    /BatchPath=C:\temp\ /BatchFile=C:\temp\DrugsOfAbuseDemo.batch.bin /Method=C:\temp\test_method_please_ignore.m /OutputPath=C:\temp\report

    And I can suddenly browse variables in debug mode!


    Thank you both!

  • Interestingly, I still need to supply a full path for the batch file.

  • Quant expects there to be a QuantResults folder present in the batch path. It then expects the batch.bin file to be in that folder. So if the paths mentioned above using the C:\temp folder are accurate then that is why you are having to specify the full path of the batch.bin file for it to work.


    I am not aware of any need to change the syntax for the switches, though I suppose if you want to access them within the code then that may be necessary. Otherwise if you specify them in the Debug dialog the syntax given in the manual and in my example should work. 

  • In the following for loop I would expect to set the full set of column names for each variable by each sample.

    for sample in DataProvider.SelectSamples("", ""):
       table.AddCell(sample.SampleGroup)

    The PDF DataSet Column Labels Reference says there's a column called SampleGroup. Instead I get an error:

    The value for column 'SampleGroup' in table 'Batch' is DBNull.

    When I add a break at the for loop, the debugger indicates there is no SampleGroup variable name.


    Basically, I've gone through the drugs of abuse dataset and added arbitrary sample groupings to different injections. I'd like to recover their attributes by groupings. How do I do this?

  • ,


    I don't do much report/script coding myself (the examples I provided were from a colleague) but in general I can suggest a few things to try.


    First if you really do just want to work on samples that are in a group, try filtering only for those. There are examples of this in the RSD07.py file I posted.


    for sample in DataProvider.SelectSamples("SampleGroup<>''","AcqDateTime"):
     if sample is not None:

        ...


    In general be aware that most of the methods used in reporting and scripting do not tolerate null entries, so you need to check for those yourself, as in the example above.


    Another thing you could try if you really want to go through all rows looking for groups is checking to see if the group is null. Most variables have a IsVariableNameNull() method that returns a boolean. There are examples in the reporting reference manual on how to use these, such as this one that checks for a dilution entry


    table.AddCell("" if sample.IsDilutionNull() else DataProvider.FormatNumber("Dilution",sample.Dilution))

Was this helpful?