


Good morning.
I decided to use this standard for PQ-Performance Verification.
This kit contains:
| Enterprise Edition LCMS OQPV Sulfa Standard 6x2 mL | 1 | 2 | 3 | 4 | 5 | 6 | |
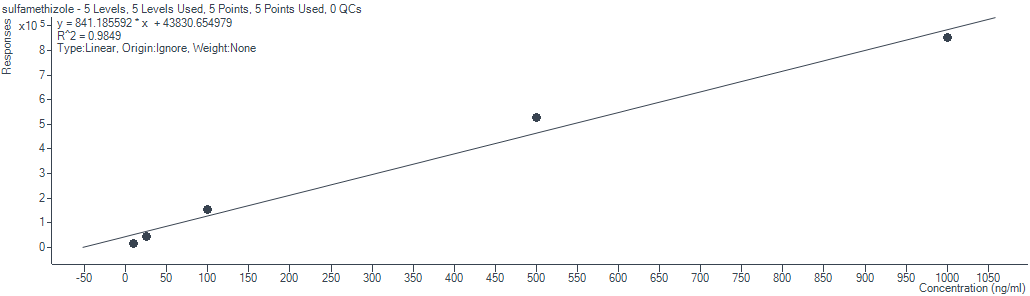
| sulfamethizol | 0.0100 | 0.0251 | 0.100 | 0.502 | 1.000 | Blank | ug/ml |
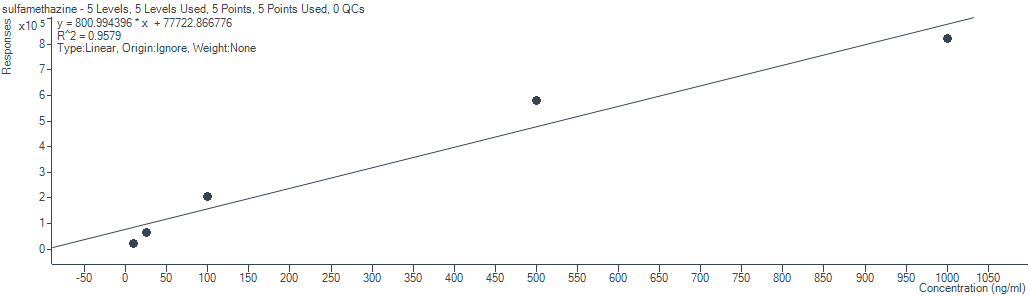
| sulfamethazine | 0.0100 | 0.0251 | 0.100 | 0.501 | 1.000 | Blank | ug/ml |
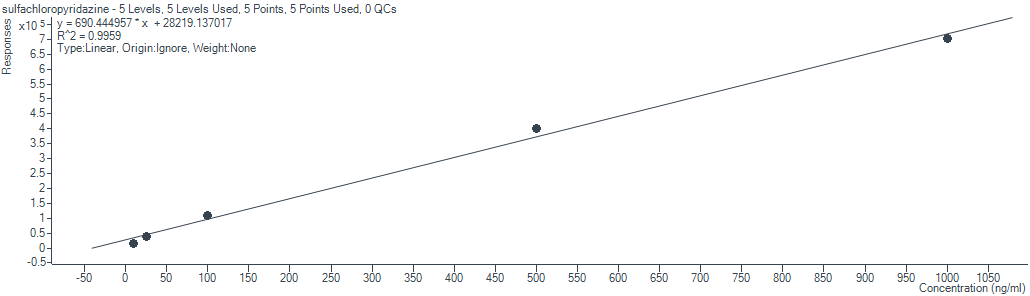
| sulfachloropyridazine | 0.0100 | 0.0251 | 0.100 | 0.502 | 1.000 | Blank | ug/ml |
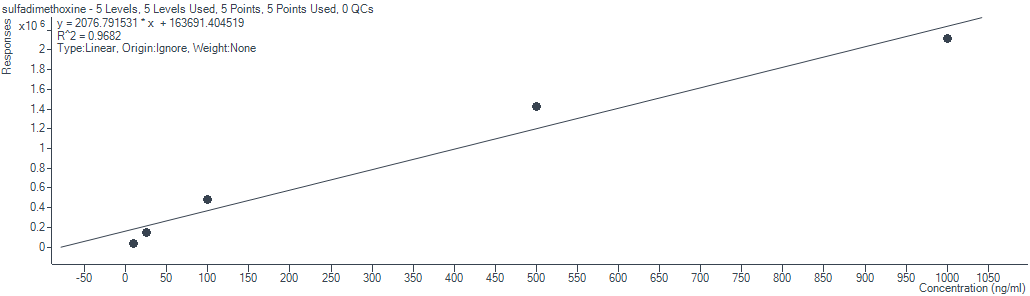
| sulfadimethoxine | 0.0100 | 0.025 | 0.100 | 0.501 | 1.000 | Blank | ug/ml |
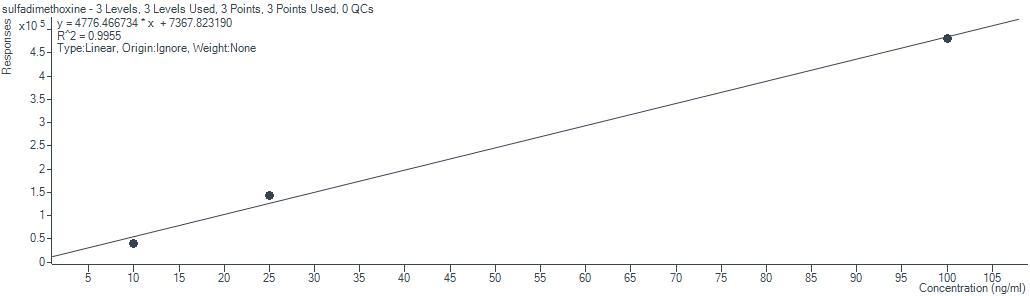
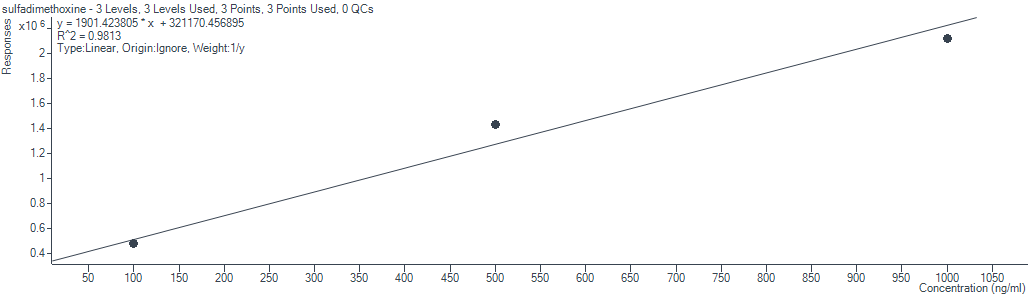
Unfortunately, my calibration curves in this range (10ppb - 1000ppb) look like this:
I decided to make a dilution from 1000ppb standard into the same concentration, thinking that maybe there is something wrong with these original standards, but the responses (linearity and regression) of these "my standards" were similar to those original.
I have chosen a linear model of regression in all our analysis. In these examples it looks like a quadratic type matches better. Should I just split it into two curves: 1st: 10- 25 and 100ppb and 2nd: 100-500-1000ppb - like in examples below?
If someone used these standards, what was the linearity and regression?
Thank you.
Robert