

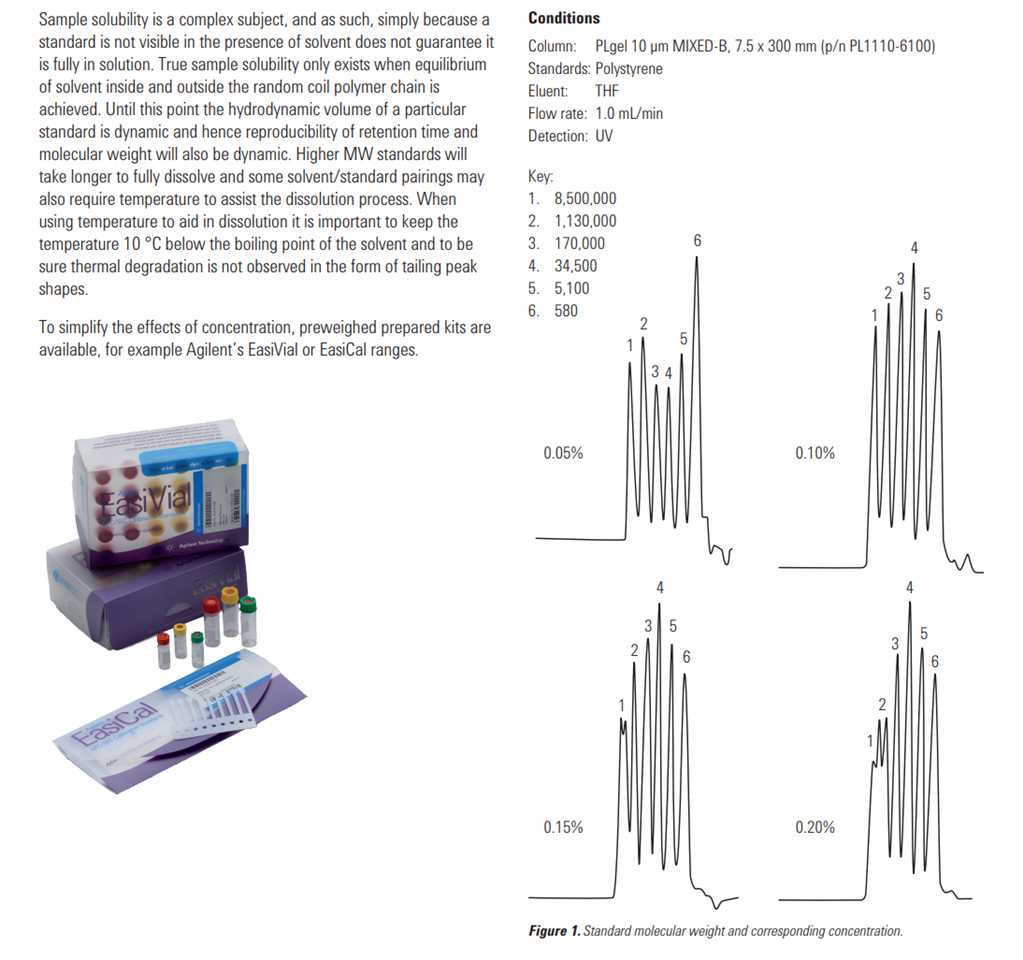
As stated in previous posts, I am new to GPC. I am trying to perform a calibration using EasiVials and have a set of 12 compounds of different MW at different concentrations (which I assume can be calculated using the stated amount of sample in the vial, the MW and the volume of solvent added). I have 2 questions on that:
I cannot figure out how to create a calibration curve like that shown below (logMW vs Retention time) on chem station.
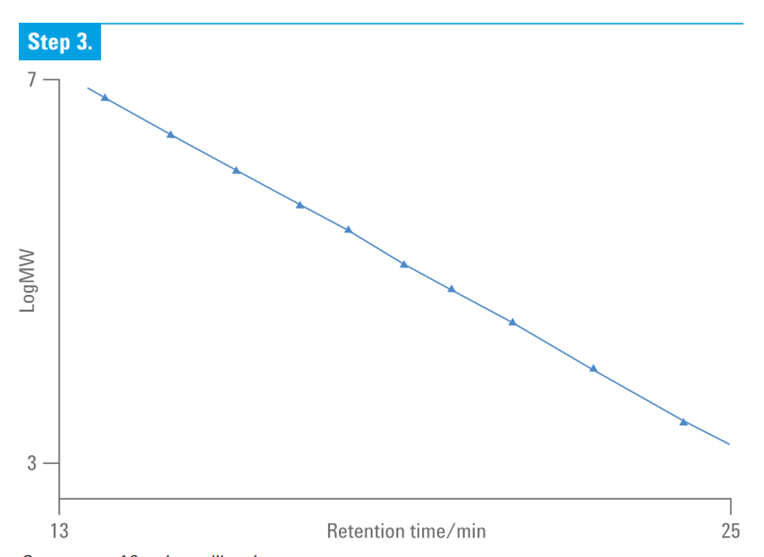
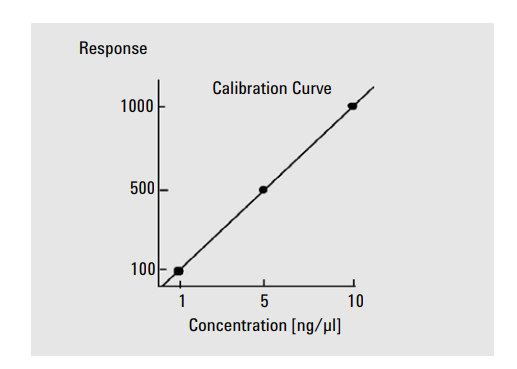
The only option I can see is Peak Area vs Concentration.
Maybe I am thinking about this wrong, but I would think in order to do a calibration like that I would need the same compound with the same MW (not 12 different ones) at varying concentration as described here (GPCstandardsPrimer_5991-2720EN.pdf (agilent.com))
Also, if I do generate a calibration curve for Peak area vs concentration from my data (I ran duplicate measurements of each red, green, yellow vial), I am not able to use all data sets, I can only generate a calibration curve for one data file including the 4 components in that vial. Can someone point me towards a good description or video that explains this?
Thank you. Bettina
