Cell metrics export

Hi, 

I am using Gen5 to analyse a fluorescence ratio at the cell level. I am struggling with the export of the "single cell data". I know that its possible to export the cell metrics of one image by going on the image and clicking on export to do a quick export. However, I will have more than 60 images at each experiment, so exporting each cell metrics of each image will be very long...

I was wondering if there was a way to export all the cell metrics of one experiment on Gen5 ?

Thank you,

Parents
  • Hello,

    I know that you worked with our TAC team on this inquiry, but I wanted to post an answer publicly for others who may have this question. Below is a short tutorial for power exporting object level details in Gen5:

    Gen5: Exporting Object Level Details

    Object level details for entire plates can be conveniently exported in a single table by using custom exports/reports.


    Limitations:

    • This option is available in Gen5 v3.06 and higher.
    • This option is not compatible with experiments that contain beacons/ROIs (Regions of Interest).
    • For kinetic experiments, you can only choose one timepoint per dataset. If you wish to export multiple timepoints, you will need to add each one to your export individually.


    Method #1: Power export to Excel:

    Go to Protocol > Export/Report Builders, and Select New Export to Excel. 

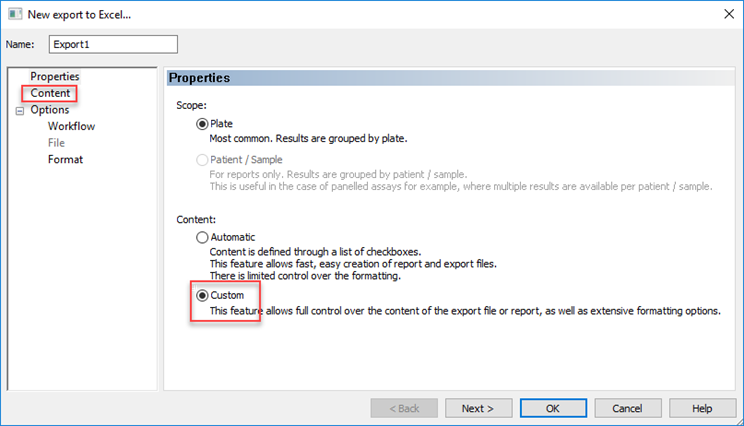
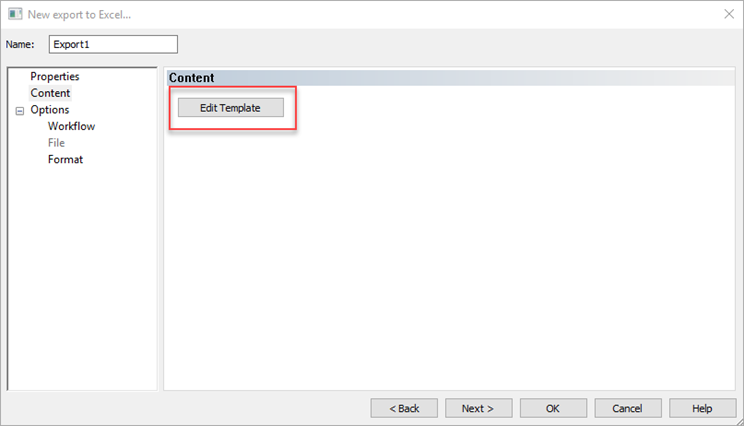
    Select custom, and on the Content tab choose Edit Template.  

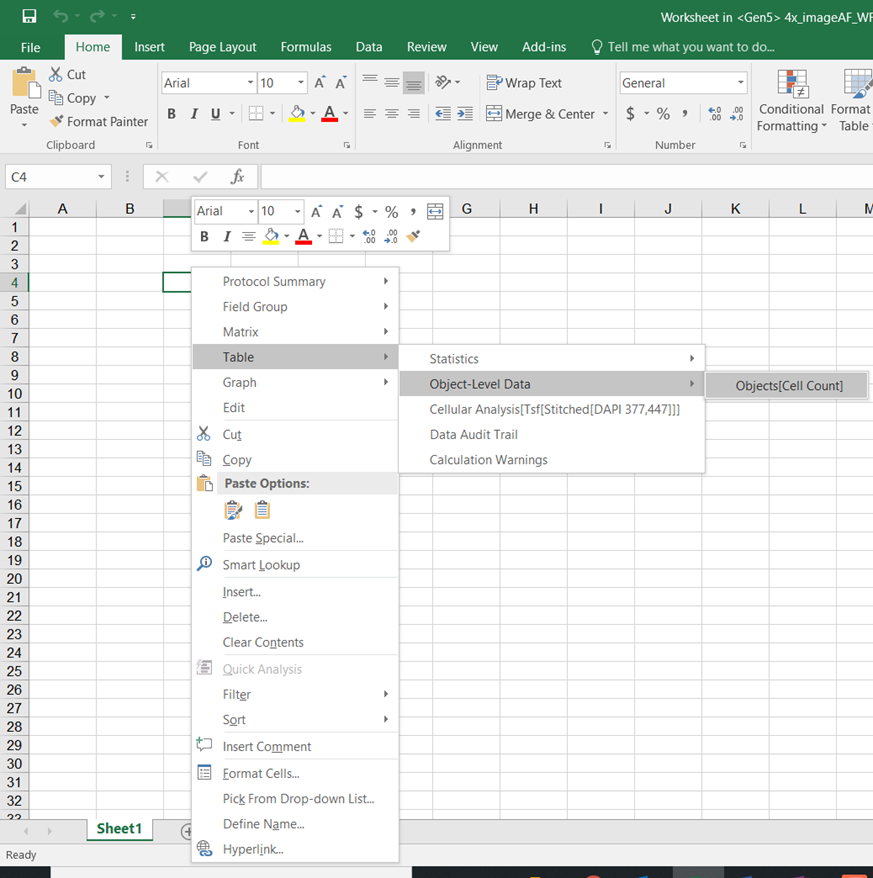
    When the blank Excel template opens, right-click within a cell and select Table > Object-Level Data and choose the data set of interest. (you can also use the “Add-ins” menu to add datasets)

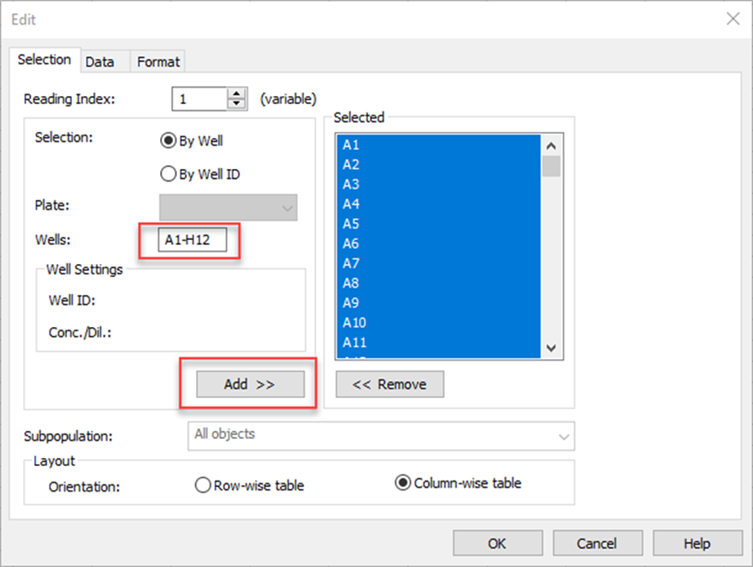
    A window to configure the format of the Object Level Details table will appear.

    Choose the wells of interest by typing in a range of wells (for example, A1-H12) and then click Add. Make other changes to the table columns or format as needed and choose Ok. Close Excel and choose Ok to save your custom export template.


    Method #2: Power export to a Report, .txt, or .csv file:

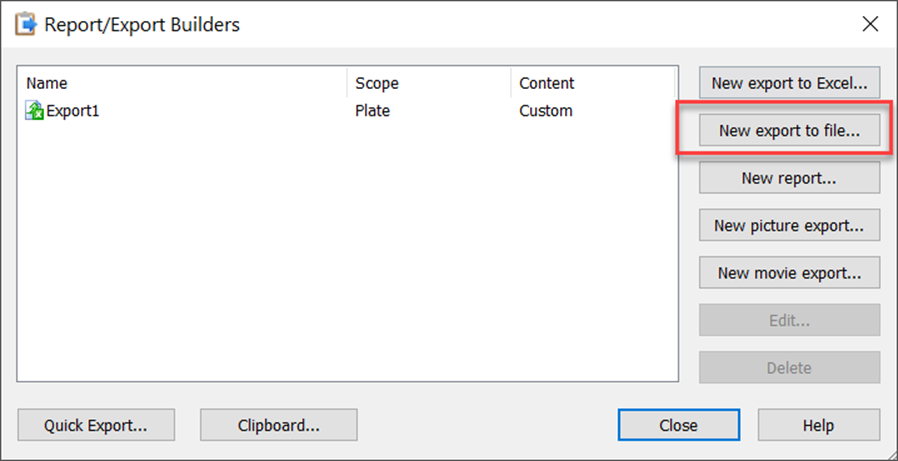
    Go to Protocol > Export/Report Builders, and choose either New Report or New export to file. A Report configures the way that data is printed to a printer or PDF file, while an export to file allows data export data to a .txt or .csv file.

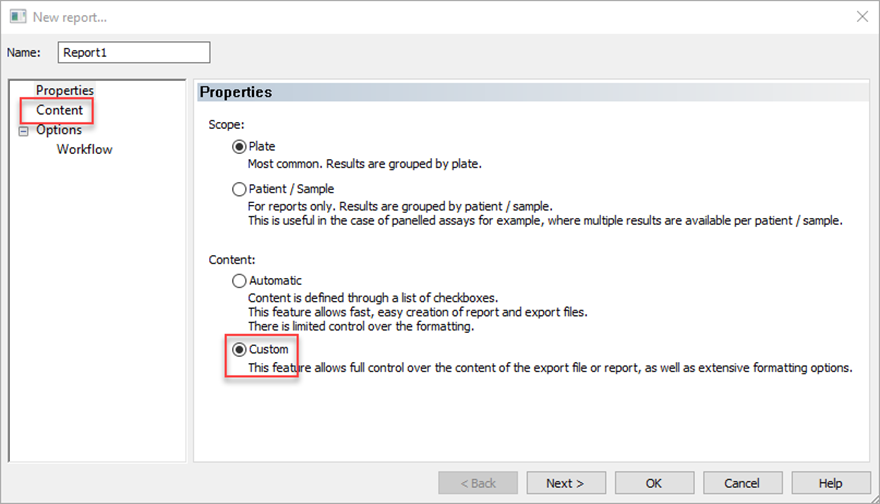
    Select Custom, and navigate to the Content tab.

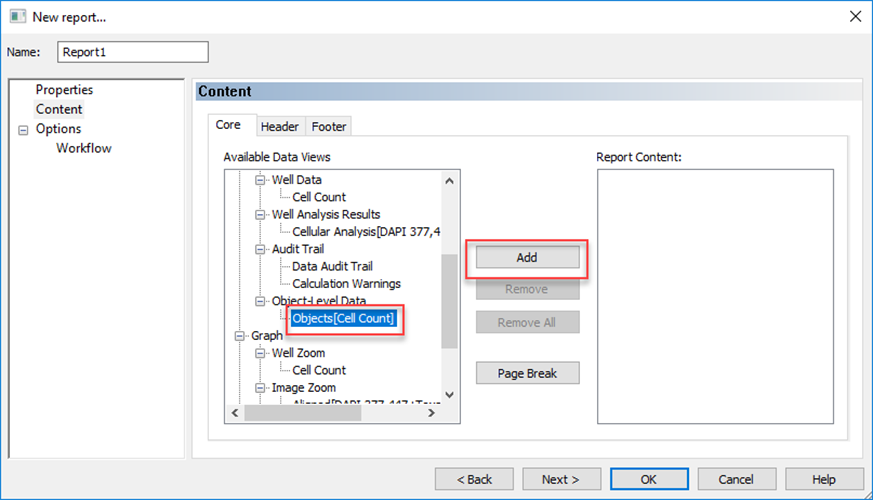
    Scroll to Object-Level Data to select the relevant data set(s), then click Add.

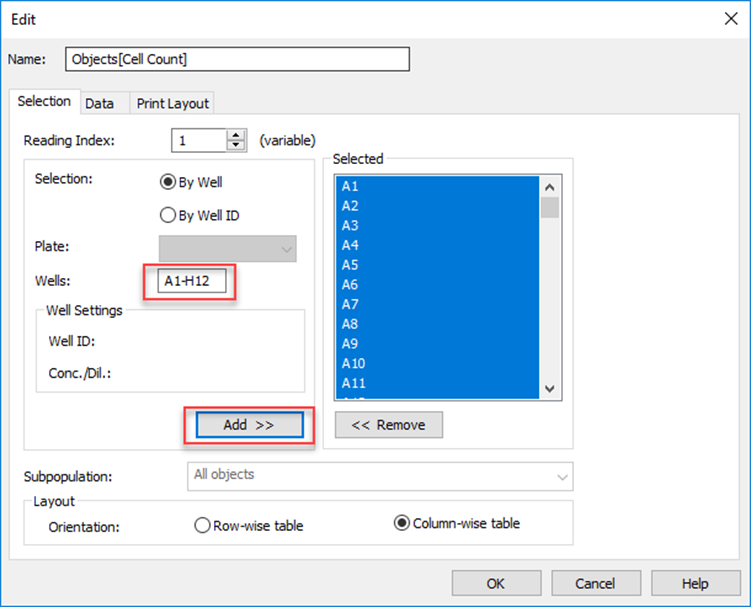
    Choose the wells of interest by typing in a range of wells (for example, A1-H12) and then click Add. Make other changes to the table columns or format as needed and choose Ok.

    If you have additional questions on our Gen5 software, you can contact bio.tac@agilent.com. We can also be reached on the phone at 800-227-9770 (option 3, option 8, option 2). 

    (Edited on 3/20/23 to add screenshots)

    Thanks,

    Wendy Cannan, PhD.
    Product Support Specialist
    Agilent Crosslab Group
    Agilent Technologies, Inc., formerly BioTek
    T: +1 800-227-9770 option(s) 3-8-2 | bio.tac@agilent.com | www.agilent.com

Reply
  • Hello,

    I know that you worked with our TAC team on this inquiry, but I wanted to post an answer publicly for others who may have this question. Below is a short tutorial for power exporting object level details in Gen5:

    Gen5: Exporting Object Level Details

    Object level details for entire plates can be conveniently exported in a single table by using custom exports/reports.


    Limitations:

    • This option is available in Gen5 v3.06 and higher.
    • This option is not compatible with experiments that contain beacons/ROIs (Regions of Interest).
    • For kinetic experiments, you can only choose one timepoint per dataset. If you wish to export multiple timepoints, you will need to add each one to your export individually.


    Method #1: Power export to Excel:

    Go to Protocol > Export/Report Builders, and Select New Export to Excel. 

    Select custom, and on the Content tab choose Edit Template.  

    When the blank Excel template opens, right-click within a cell and select Table > Object-Level Data and choose the data set of interest. (you can also use the “Add-ins” menu to add datasets)

    A window to configure the format of the Object Level Details table will appear.

    Choose the wells of interest by typing in a range of wells (for example, A1-H12) and then click Add. Make other changes to the table columns or format as needed and choose Ok. Close Excel and choose Ok to save your custom export template.


    Method #2: Power export to a Report, .txt, or .csv file:

    Go to Protocol > Export/Report Builders, and choose either New Report or New export to file. A Report configures the way that data is printed to a printer or PDF file, while an export to file allows data export data to a .txt or .csv file.

    Select Custom, and navigate to the Content tab.

    Scroll to Object-Level Data to select the relevant data set(s), then click Add.

    Choose the wells of interest by typing in a range of wells (for example, A1-H12) and then click Add. Make other changes to the table columns or format as needed and choose Ok.

    If you have additional questions on our Gen5 software, you can contact bio.tac@agilent.com. We can also be reached on the phone at 800-227-9770 (option 3, option 8, option 2). 

    (Edited on 3/20/23 to add screenshots)

    Thanks,

    Wendy Cannan, PhD.
    Product Support Specialist
    Agilent Crosslab Group
    Agilent Technologies, Inc., formerly BioTek
    T: +1 800-227-9770 option(s) 3-8-2 | bio.tac@agilent.com | www.agilent.com

Children
No Data
Was this helpful?