Hello,
I have a question concerning the use of Open Labs advanced Report Functions.
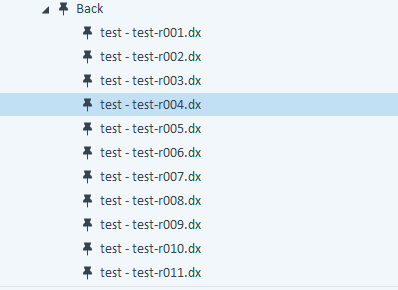
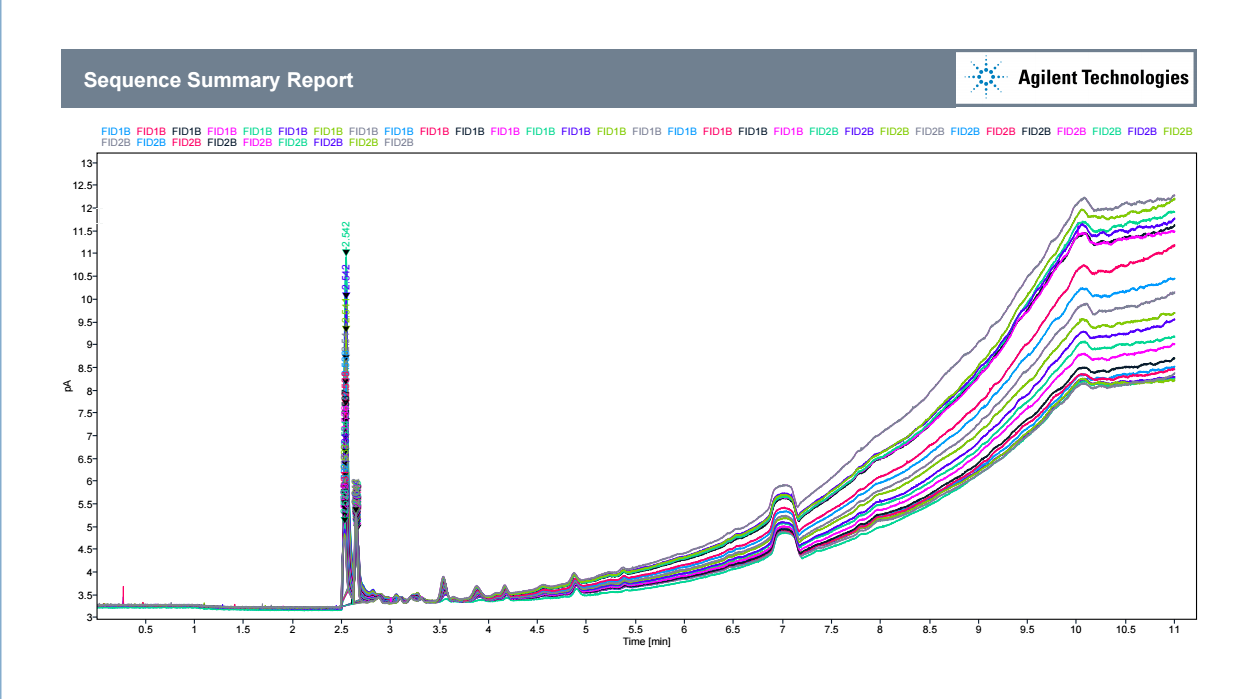
After the run I select all the samples. All signals I want to overlay.
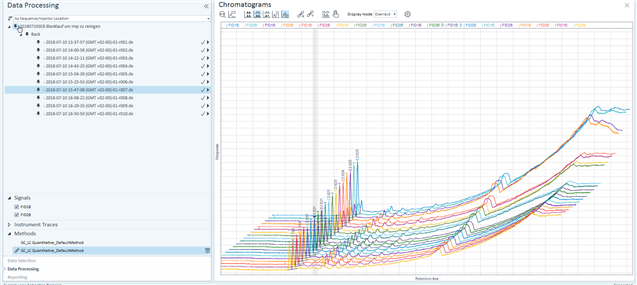
Then I select Chromatogramms
How can I generate a report which look like this ?
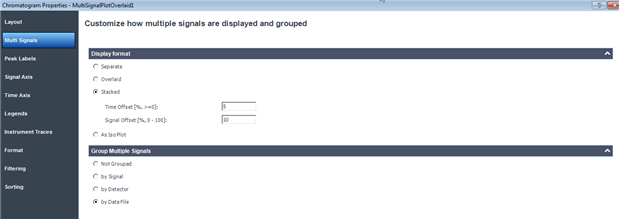
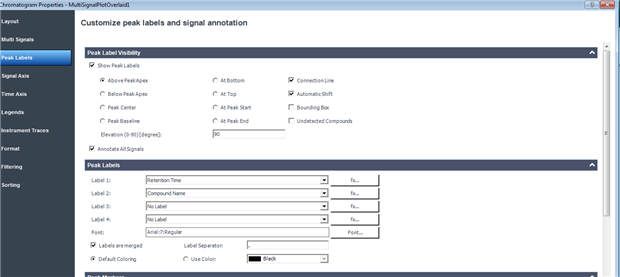
I tried already to select the " Multi Signal Plot Overlaid "
then select on the Spectrogramm.
What do I have to do to solve the problem.
Thanks in advanced for your help.
:-)

