Overlay Multiple Spectrogramms with Open Lab 2.1

Hello,


I have a question concerning the use of Open Labs advanced Report Functions.


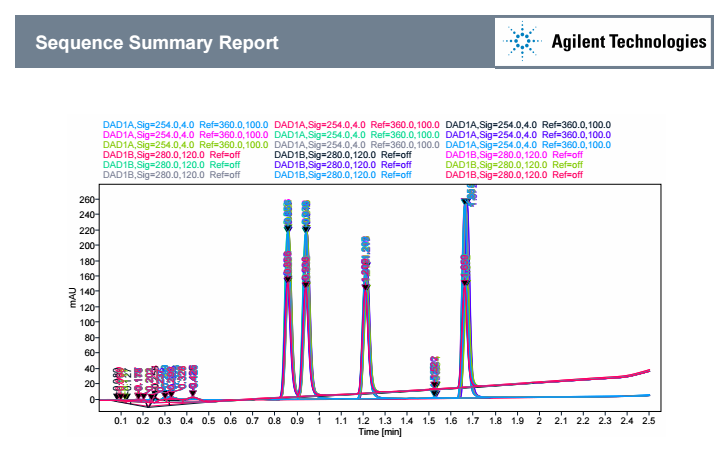
After the run I select all the samples. All signals I want to overlay.


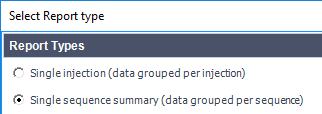
Then I select Chromatogramms


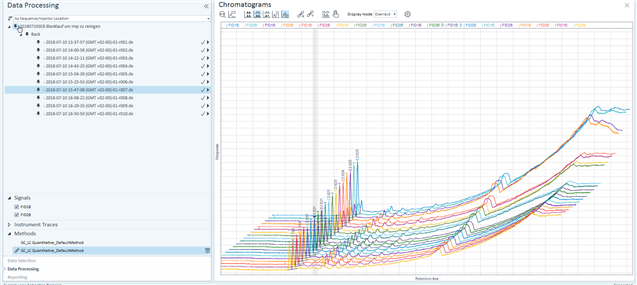
How can I generate a report which look like this ?


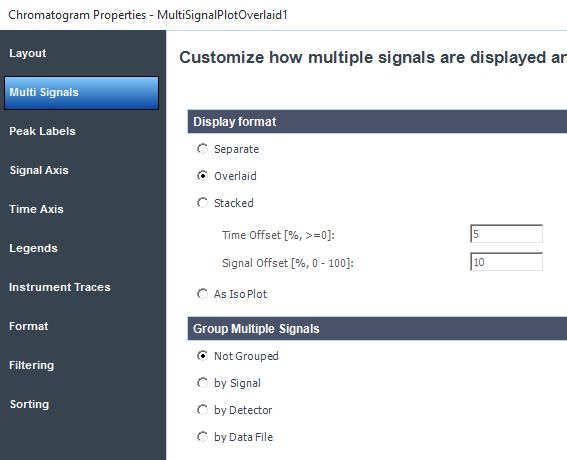
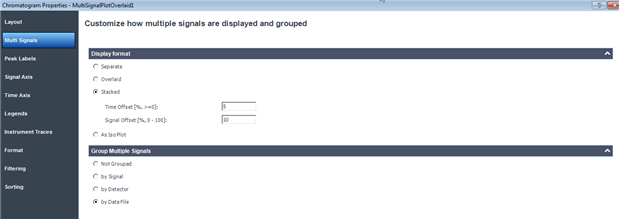
I tried already to select the " Multi Signal Plot Overlaid "

then select on the Spectrogramm.


What do I have to do to solve the problem.

Thanks in advanced for your help.

:-)

Parents
  • Hello mr.white,


    You can do this with a sequence summary report template:

    Use 'Multi Signal Plot Overlaid' as you've done already; in the properties, the signals need to be overlaid. You may group by signal e.g. FID Front signal/ FID Back signal or, if you want to overlay all signals, not have them grouped.


    I did this below for two DAD signals rather than FID but the principle is the same. If you don't want everything overlaid, you would need to filter your signals in the reporting properties.


    I hope this helps,


    Sara

Reply
  • Hello mr.white,


    You can do this with a sequence summary report template:

    Use 'Multi Signal Plot Overlaid' as you've done already; in the properties, the signals need to be overlaid. You may group by signal e.g. FID Front signal/ FID Back signal or, if you want to overlay all signals, not have them grouped.


    I did this below for two DAD signals rather than FID but the principle is the same. If you don't want everything overlaid, you would need to filter your signals in the reporting properties.


    I hope this helps,


    Sara

Children
No Data
Was this helpful?