OpenLAB Custom Calculator

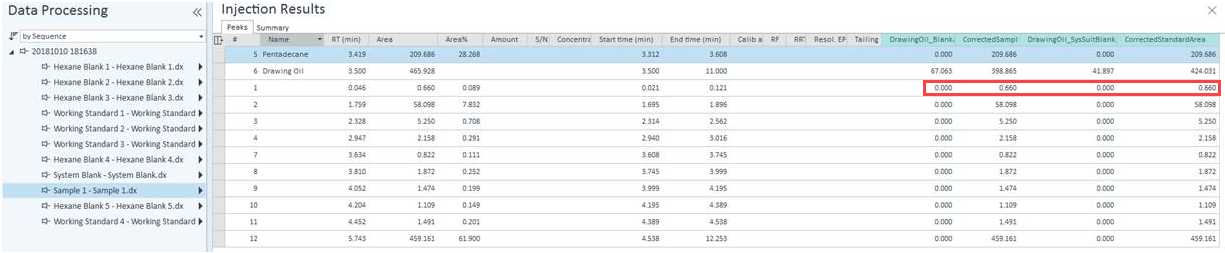
After running a GC sequence which generates data for blanks, standards, method blank and samples - I would like to subtract the area for a particular compound or timed group for the method blank from each of the samples.

I have been using the CC Editor to put custom calculations into the Injection Results tab of the sequence when viewing the data in data analysis (DA).  But I cannot seem to make it subtract one from the other. When you click on a particular injection in the sequence, it only gives you the data for that injection and does not give you the data for the method blank for exmple if you are viewing the sample injection?

Any help would be appreciated.

Parents
  • Hi Ryoboyle,

                    Thank you for these tips – this worked wonderfully.

                    I even managed to change the blank for a system suitability blank – such that I could subtract the method blank from the sample areas and the system suitability blank from the standard areas.

                    The only thing I struggled with was the second calculation, which wouldn’t work initially as written.

                    I then tried : Compound_Area-CC14, CC14 was the custom calculation for the blank area.  This worked fine.


                    Now, my next problem is that I couldn’t find a way to get the subtracted result calculation into the report editor, when I tried to use the field ‘Custom Calculation Results’ in the Fields and then Compounds option – it imports the description correctly but not the actual result – it gives me a zero result for the blank area and it picks the area of peak one from the result table and displays this in the corrected area field.


                    Any help here would be highly appreciated.

                    Apologies for the late reply, I have been out of the office for a few days and could not try these calculations.

  • Are the correct values being displayed properly in the Injection Results window in Data Analysis? If so, then there shouldn't be a problem with those values then being pulled onto a report. Are you trying to add the correct area as a new column in a results table on the report template? Can you send me screenshots of what is happening on the report?

Reply Children
  • Hi Ryoboyle,

    Yes the correct values are being displayed in the Injection Results window in Data Analysis.

    And yes, I am trying to import this/these corrected area/areas into the report in a column and then I would like to do some further calculations with this/these values.

    I haven’t formally created a proper report template yet, as I have been trying to get all the individual parts of the data/calculations available for the report – after which I will try to go ahead an build the report proper.


    But please see some screen shoots of the Injection Results window to illustrate that the calculation is working fine in Data Analysis:


    The drawing oil blank area (67.063) is area of the oil peak(timed group) in the System Blank Injection, and the calculation has correctly subtracted it from the drawing oil peak area (465.928) in the sample to give the CorrectedSampleArea as 398.865.

    In an analogous way, the drawing oil peak area from the Hexane Blank 3 injection (called the system suitability blank) is subtracted from each of the Working standard drawing oil peak areas to produce the CorrectedStandardArea.


    Below is an image of the current report, which as I have said previously is more a collection of items rather than a fully formatted report yet:


    As you can see it is not picking the correct oil areas for the System Blank or the Hexane Blank 3 injections and then the calculations for the Corrected areas do not represent what is going on in the Injection Results window in Data Analysis.

    Really appreciate any help/assistance with this,


    Regards,

    Naweed

    attachments.zip
  • Hi Ryoboyle,

    Thank you for this clarification and direction.

    I think some of my deficiency comes from not being very good at the report template editor.

    But I will use the table that currently shows Pentadecane and filter it for the drawing oil peak and add the fields for the custom calculations as extra columns in that table and hopefully we can import in the correct data.


    Appreciate all the help and support – but it looks like I may need more of your expertise.

    Have a good weekend,


    Regards,

    Naweed

  • Hello,


    Thank you for the screenshots. It think this comes down to how you are filtering those report items on your template. Is the table along with the fields below for the custom calculation results grouped together and filtering for Compound_Name = "Pentadecane" ? 


    The custom calculation fields on the report appear to be just reporting the results for the first eluting integrated peak:


    This implies that the report is pulling in the custom calculation results onto the report, you just need to give the report template further instruction if you want a specific compound's custom calculation results to be displayed. Grouping the fields and filtering the group for the compound name should resolve that. 

Was this helpful?