Multiple calibration level and % residual error on each point.

Hi, 

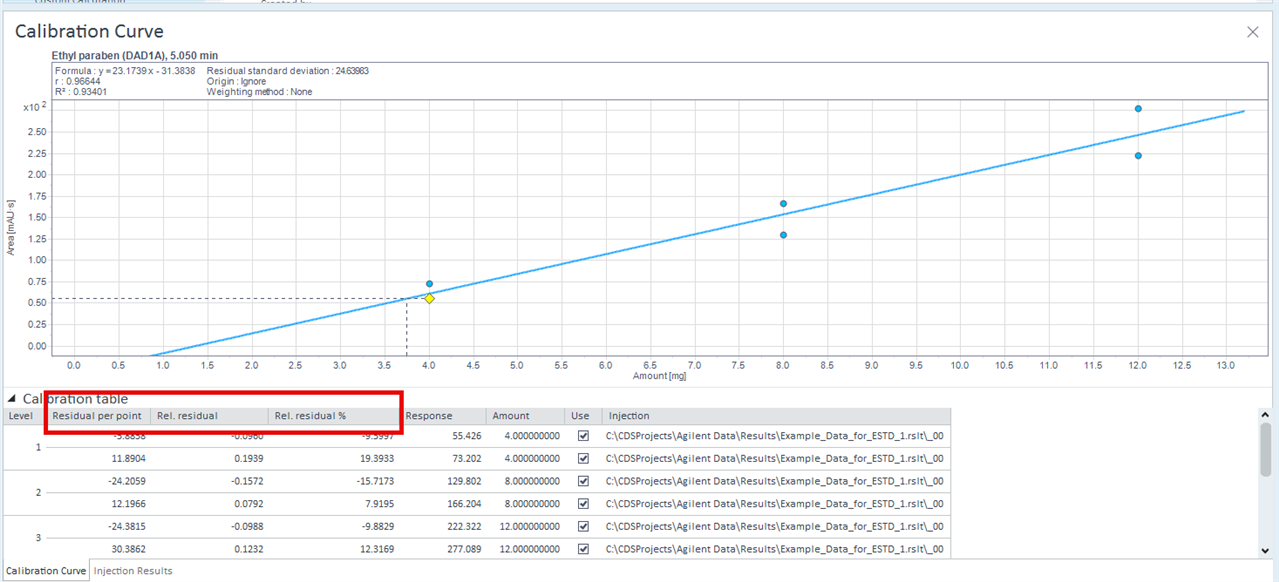
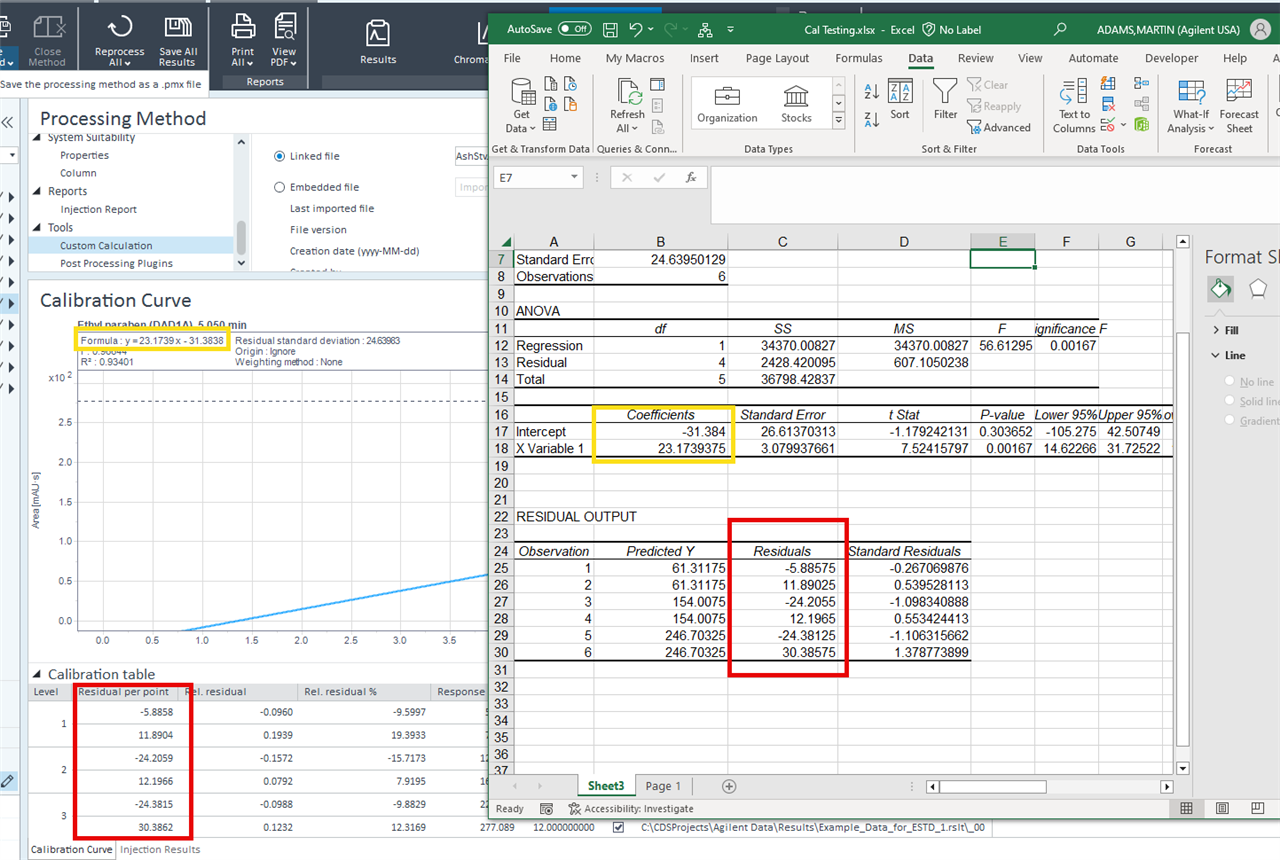
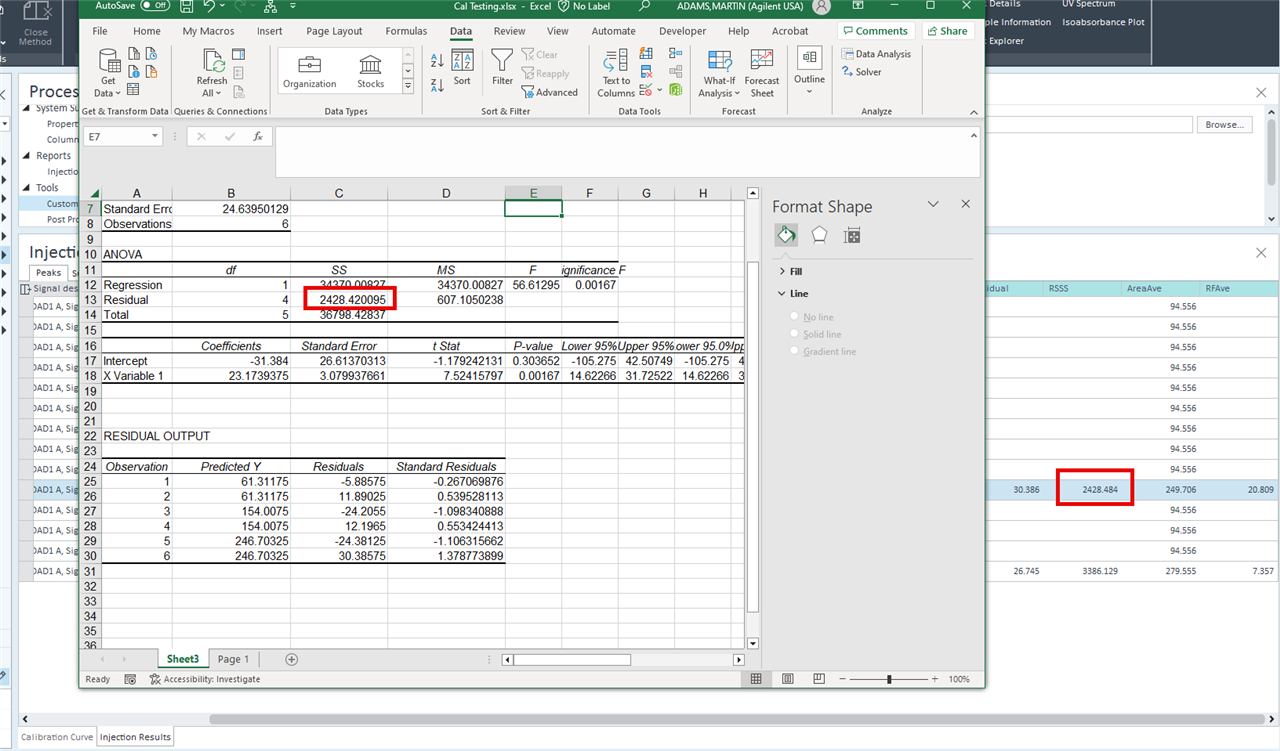
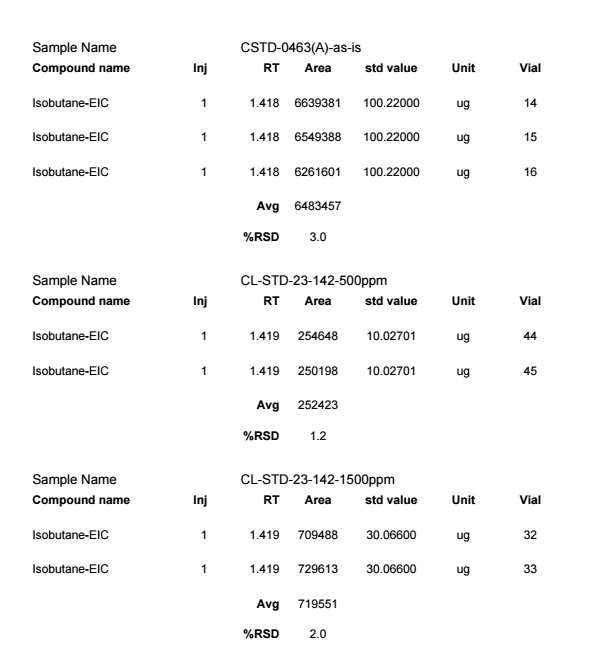
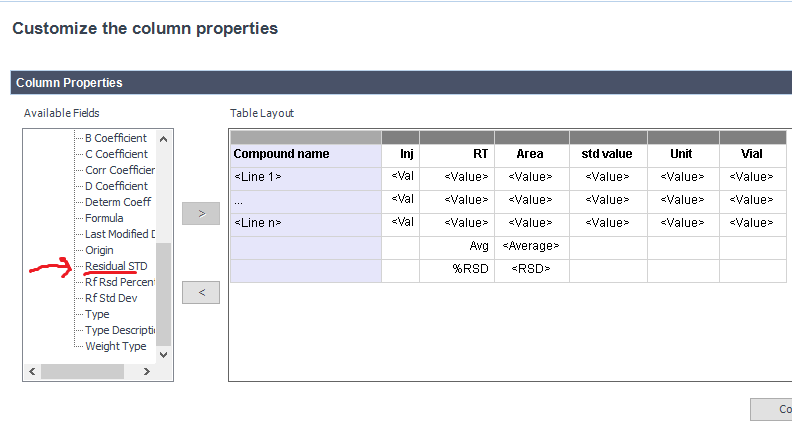
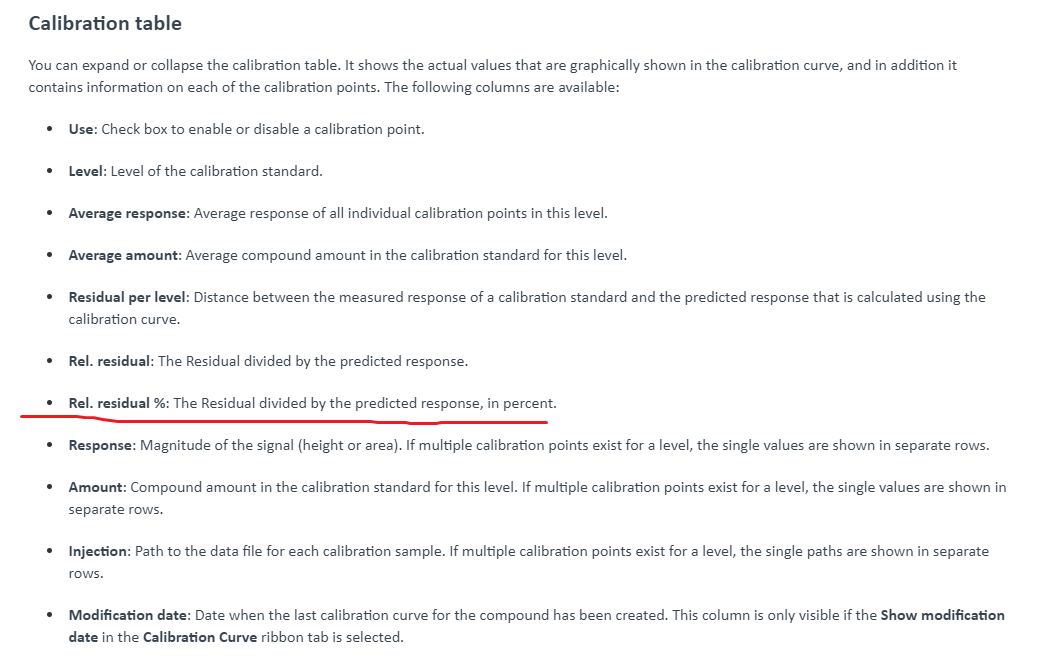
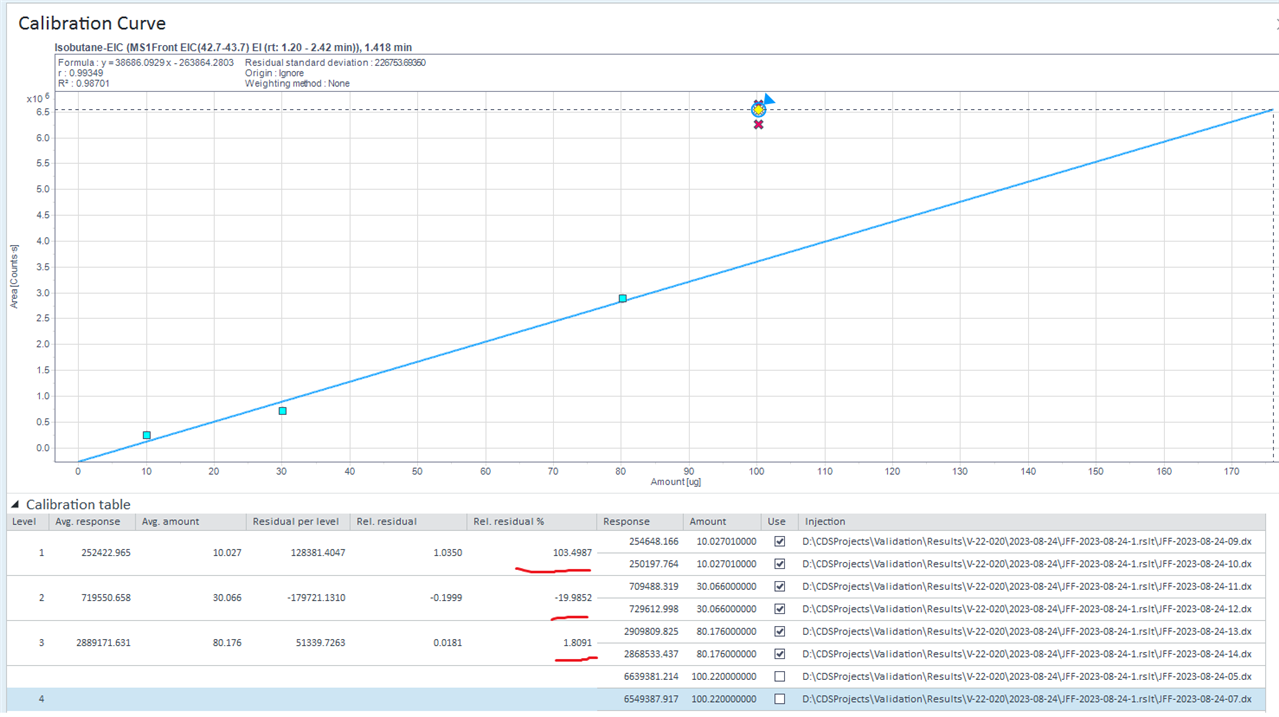
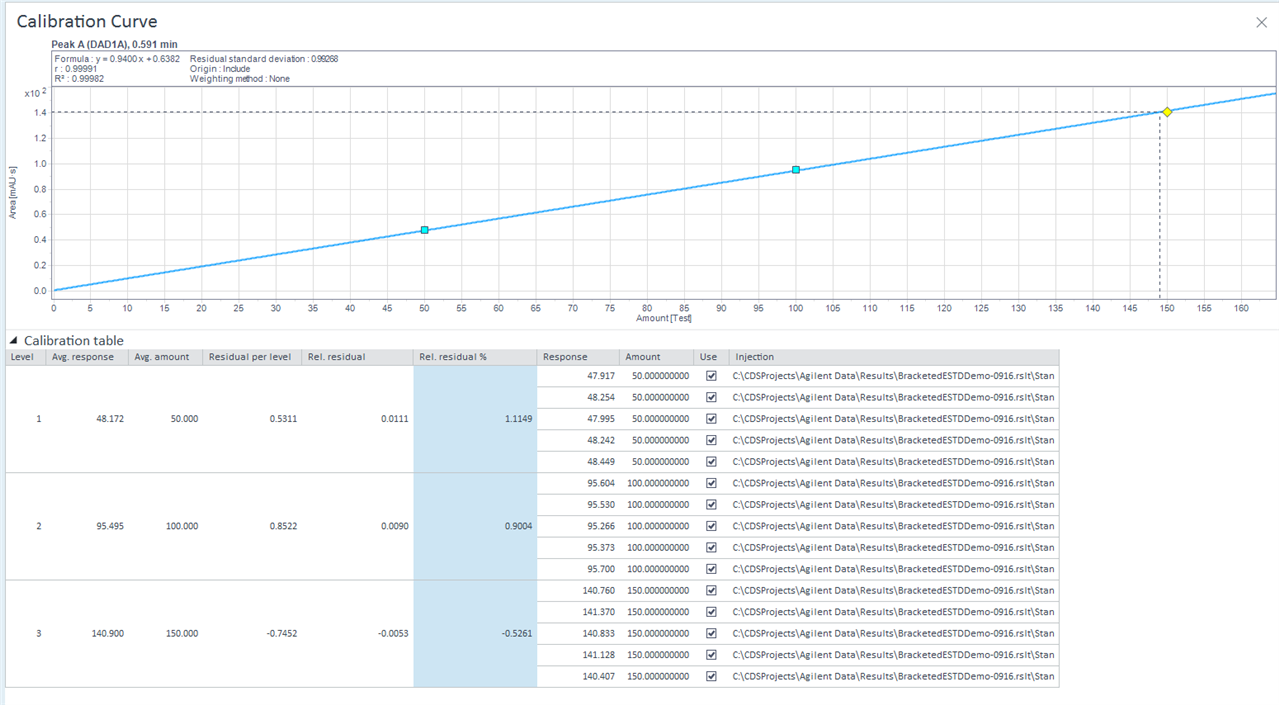
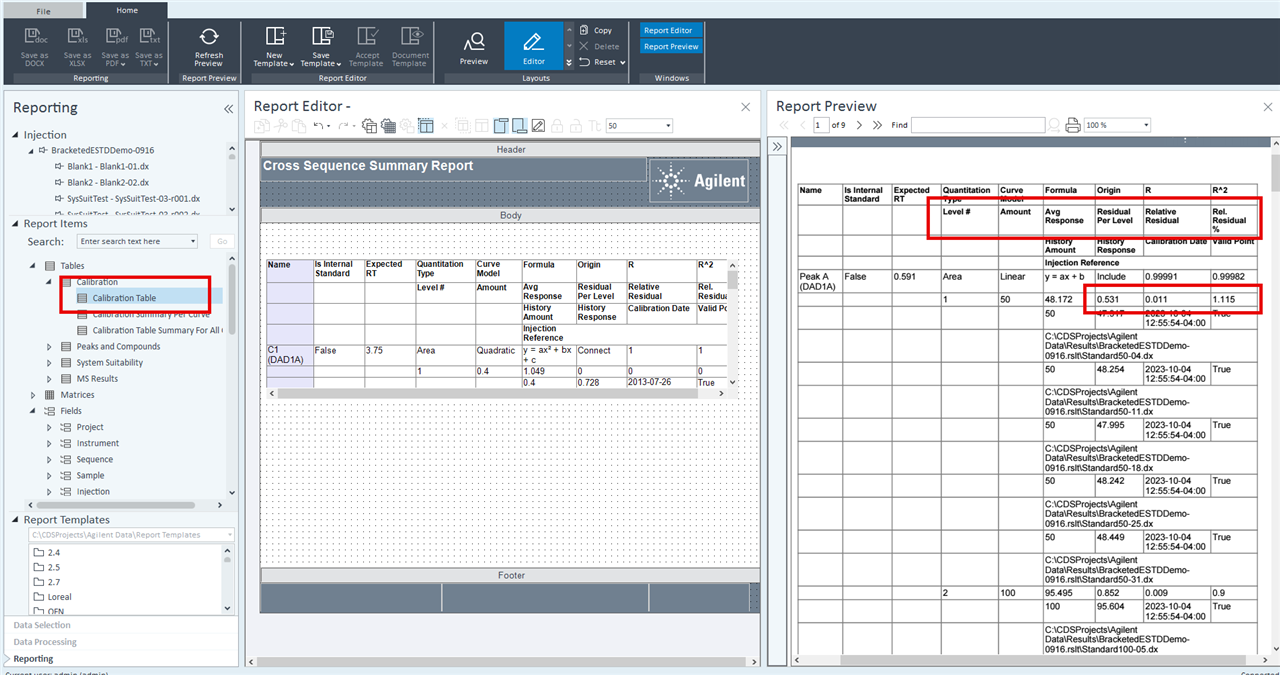
I want to show my statistical deviation on each point in openlab CDS report for a multiple level calibration. 

For example, if I perform a 4 level butane calibration curve from 500 to 5000 ppm, I want to show the residual déviation on each point in a report. 

Can you help me doing this? 

Thank you. 

JF Fortin

  • Do you mean the vertical distance between each point and the curve? If so, theoretically it shouldn't be too hard, but practically it is if you don't know what type of curve it will be beforehand. I'm unaware of any features that allow you to do this easily, but there may be some. What I have done previously is save the calibration curve constants, then use those along with the calibration curve type to calculate it. It will be much, much easier if you know that it will only be a specific type of curve (e.g. linear). You can follow the steps below:

    1. Filter for the last calibration injection within the bracket for this curve (if you are using the default bracketing mode) using a group.

    2. Save the curve coefficients (CalibCurve_A_Coefficient, CalibCurve_B_Coefficient, and CalibCurve_C_Coefficient), which you should be able to find in the variables. Save them with a scope of Compound_Name.

    3. Make a table and filter for Sample_Type=1, repeat by column (by group or by the table repeat)

    4. In one of the columns, use the Area (or concentration depending on which is on the x axis) along with the coefficients to calculate where the curve predicts and subtract that from the concentration (or area depending on which is on the y axis). For example, if your plot has area on the y axis and concentration on the x and the curve is linear your formula would be =Peak_Area - (CoeffA(Compound_Name)*Compound_CalibAmount+CoeffB(Compound_Name)), where CoeffA(Compound_Name) and CoeffB(Compound_Name) are the previously saved variables for the coefficients.

    This will be complicated by having multiple curves for one compound within the sequence so you will need to adjust some things if that is your case. In my case I allowed all types of curves, which requires a big if statement and a few numerical checks beforehand, but trust me when I say you want to keep it simple if at all possible.

    Good luck!

    -Cole

  • Thank you Cole, I will try that. Basically, I want the % deviation of each point that are in my calibration curve. So I think you got it right. I will try it next week and comeback to you if it works.  Thank you again. 

  • Hello,

    I am not sure this is what you are looking for from the original post. The software calculates the residual, relative residual, and residual percent for the individual calibration points or the average per level depending on the method setup. The calibration table object can be used to display the values on the report. If you want something like the residual sum of squares, then that would be a custom calculation. 

  • Thank you again for your help and explanation. I will try this today and see how I can put it into a report templates. 

  • Hi Martin, 

    I processed my 4 level curve that contains 3 compound (butane, isobutane et propane). 

    To put you in context, here is a printscreen of my injection list. As you will see, I injected replicates for each level. 

    As is injections are related to the 5000 ppm curve point. 

    The report template is showing the curve, the statistic of the replicates and the average. The group is grouping by compound name. Everything is ok for that. 

    Here the section that show all injections involved:

    I tried to add the % residual std of each points but I can't find the value. Only residual std seems to be available. 

    How can I show this value ? we have the definition on the online help that explain what's % Residual std is calculated. 

    But looking at the curve, the % Residual Std seems to used the average of each curve point replicates. 

    So it might be impossible to show % rel residual of each point but how can I at least find the field on report template of the value shown on the processing screen? 

    Thank you 

  • Hello,

    As I said unless you want to recalculate them using CC or in IR the residual values are only available in the calibration table object. Those values are not available as individual field variables that you can add to any table. That calibration table object is custom and has limited properties. I saw another post with a question about sorting in email, but you may have found the answer and updated this post. If not and I just missed it the Sample_CalibrationLevel field is what you wanted to sort. 

    Marty

Was this helpful?