


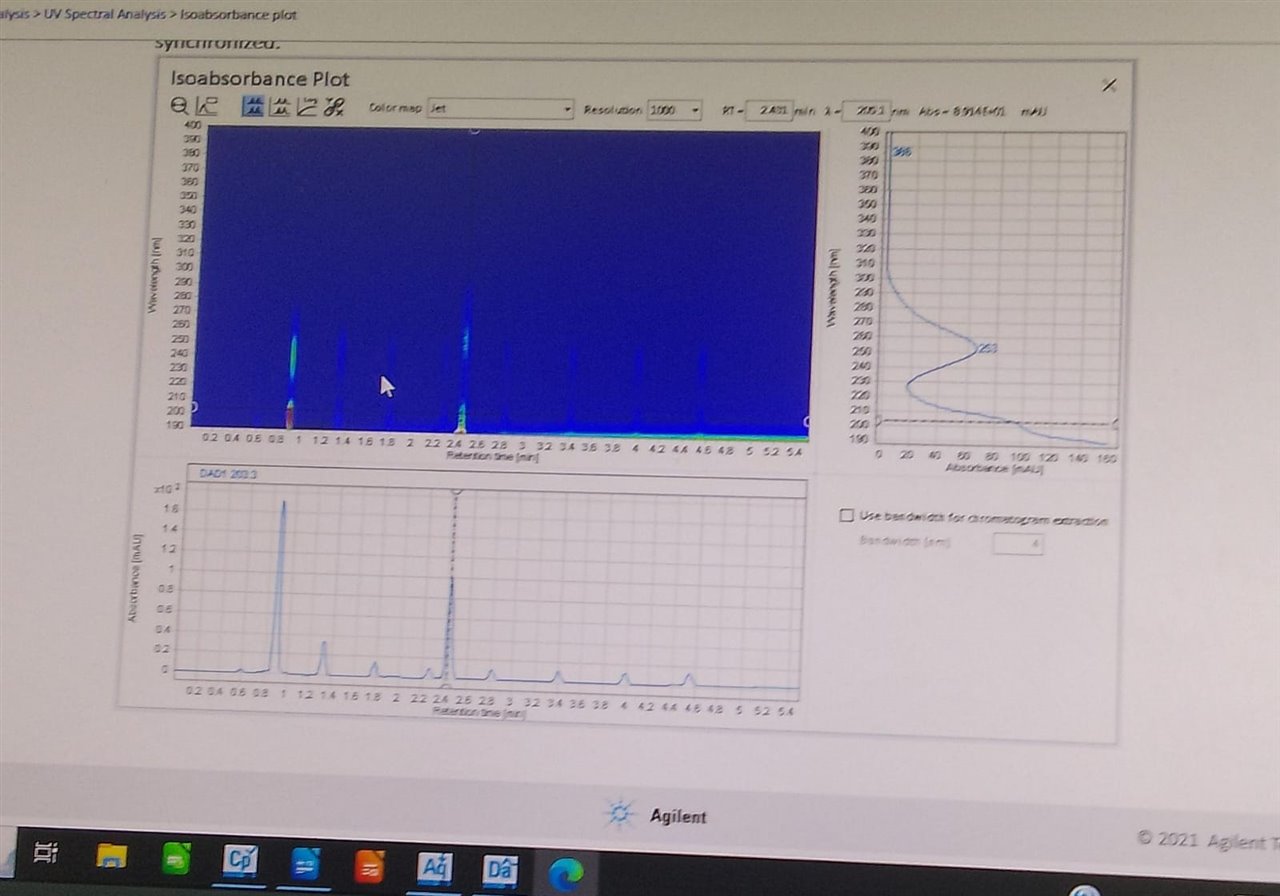
This image is from HELP document where BLUE JET Isoabsorbance plot and spectral graph are able to see,
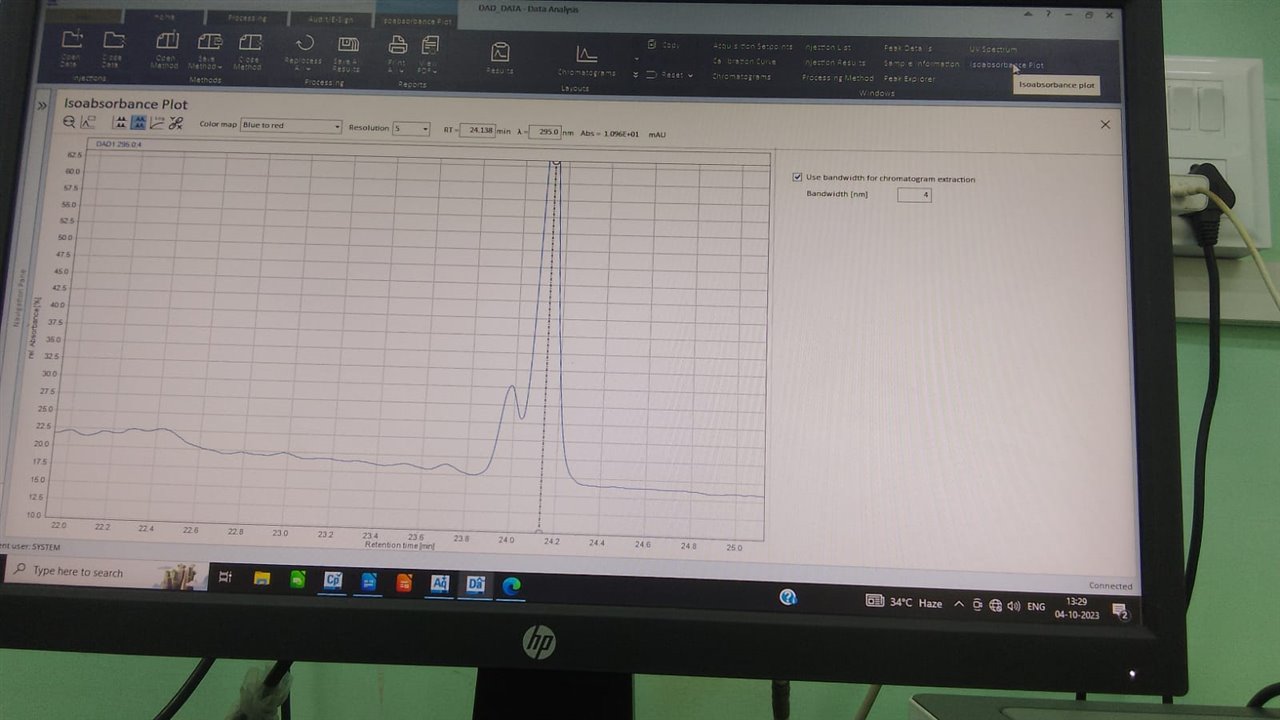
But in Open lab CDS software of mine the second image the JET and spectral graph are not visible how can i get them
This image is from HELP document where BLUE JET Isoabsorbance plot and spectral graph are able to see,
But in Open lab CDS software of mine the second image the JET and spectral graph are not visible how can i get them
