Calib Curve Plot by compound

Hi, 

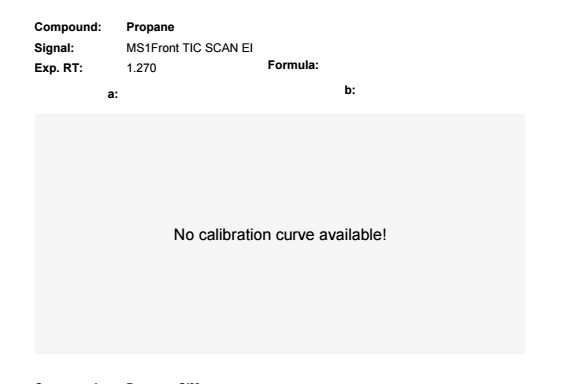
I have 65 target compound and we aren't doing calibration for all of them routinely. 

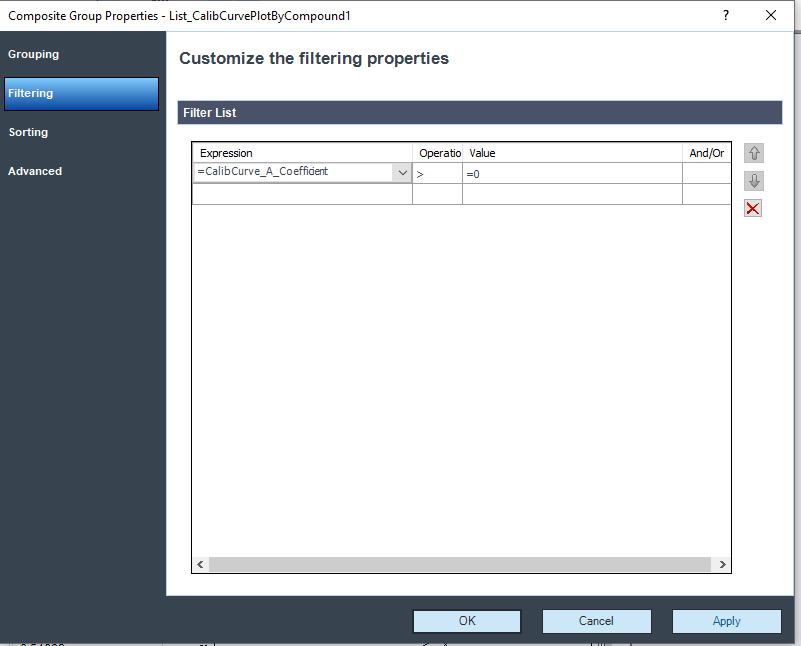
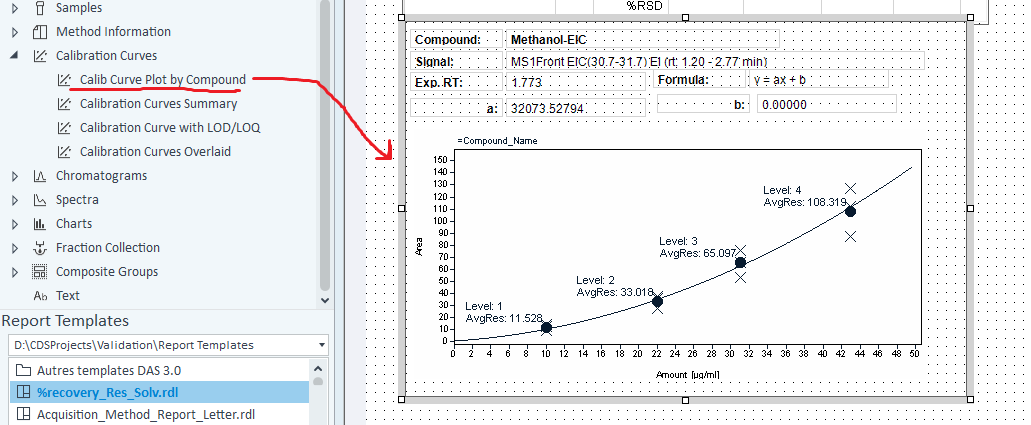
I used this item to show the 1 cal curve for your limit test USP 467. 

How I can programmed this particular item so if no value are entered into a specific compound, no result at all will be shown instead of telling "no calibration curve available".

Thank you. 

Parents
  • Hello,

    Filter the outer group by something like the example below. You might also be able to use calibration type or some other value in the filter. In the example below, Peak B was not calibrated, and thus did not display in the report. 

    Marty

  • I worked perfectly when I ask coefficient a to be more than zero. thank you again! 

  • I would note that this will only work when "a" is greater than zero, meaning if you have an "a" that is negative it will also filter out those. If you are only using linear curves for calibrations that you expect to be positive correlations, then you should be fine. If not, then you should consider changing it to something like "len(cstr(CalibCurve_A_Coefficient)) > 0", which has worked in the past for me when I want to detect whether or not an internal variable has been set.

  • Oh thank you for your help. I will surely try it. Can you explain me a little more about the programming function of len and cstr? Thank you again for your precious help and advice. 

  • Hello,

    You can search online for VB functions len and cstr for more detailed information if you need to as the expressions in IR are VB based. In the example, provided by ColeFunk the CalibCurve_A_Coefficient value was converted to a sting and then the length was determined. This would only be needed only if the value of the field could be negative. In this example, any non null value in that field will have a length > 0 and thus meet the filter limits. You could likely also use field <> 0 as well or a Vb is null or empty test as another alternative. 

    Len() - returns the length of a string.  

    Cstr() - converts the data type to a string.

    Marty

  • Thank you very much Martin Again. I added this function that Colefunk suggested. In our example here, there is no issue because we don't have negative slope. But If we use MHE (Multiple Headspace extraction in future, since it's a Log curve, we will have a negative slope and so this function will help. Can you explain me the meaning of " IR are VB?" How can I know tha I have to change data type to a string? I'm not a programmer, sorry, I'm just a chemist. lol  

  • Hello,

    It means that the expressions you create in IR are in visual basic (VB) syntax. This allows use of standard programming functions that are familiar to anyone that has used VB. It also means that if you are trying to do something in the software expressions, you can search the internet for advice and information on VB syntax that will be applicable. I am not sure how to explain data types in this context. For example, I want to embed a RT value in a text string on a report.  I know that the RT is a numeric value so if I try ="My test peak is at " & Peak_RetentionTime it will give an error as it cannot add a numeric value to a string. However, I could use ="My test peak is at " & Cstr(Peak_RetentionTime) instead and I would get a valid returned string. Please note in some cases the first example would work in more recent versions as the renderer has some ability now to convert data types automatically. When I see the resultant output and the RT has 15 decimal places I might lookup formatiing strings in VB on the internet and find the function formatnumber. Using that function, I would change the expression to ="My test peak is at " & FormatNumber(Cstr(Peak_RetentionTime),3) to get the final output I wanted. 

    Marty

Reply
  • Hello,

    It means that the expressions you create in IR are in visual basic (VB) syntax. This allows use of standard programming functions that are familiar to anyone that has used VB. It also means that if you are trying to do something in the software expressions, you can search the internet for advice and information on VB syntax that will be applicable. I am not sure how to explain data types in this context. For example, I want to embed a RT value in a text string on a report.  I know that the RT is a numeric value so if I try ="My test peak is at " & Peak_RetentionTime it will give an error as it cannot add a numeric value to a string. However, I could use ="My test peak is at " & Cstr(Peak_RetentionTime) instead and I would get a valid returned string. Please note in some cases the first example would work in more recent versions as the renderer has some ability now to convert data types automatically. When I see the resultant output and the RT has 15 decimal places I might lookup formatiing strings in VB on the internet and find the function formatnumber. Using that function, I would change the expression to ="My test peak is at " & FormatNumber(Cstr(Peak_RetentionTime),3) to get the final output I wanted. 

    Marty

Children
No Data
Was this helpful?