Showing SIM MS plot on an openlab CDS 2.x report

Hi everyone. 

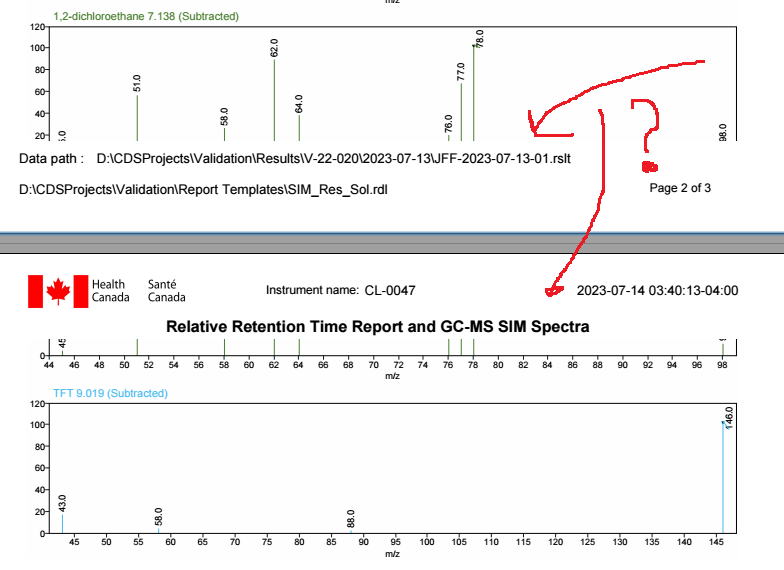
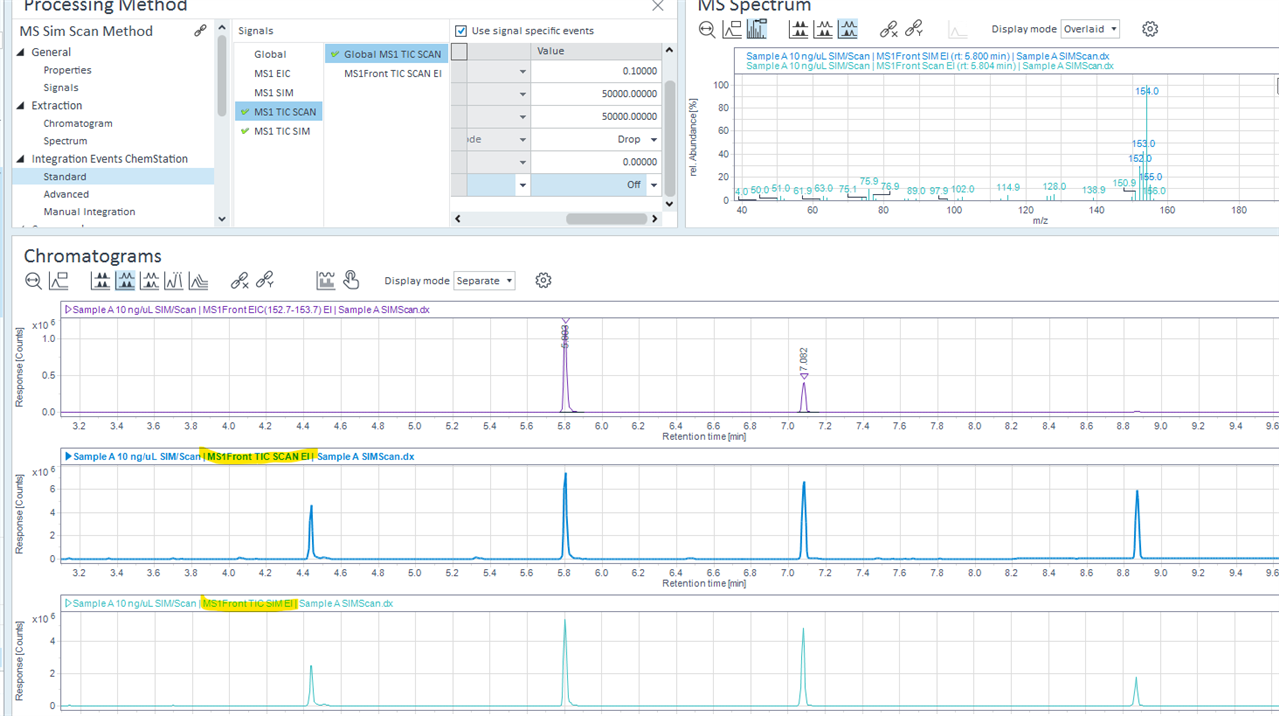
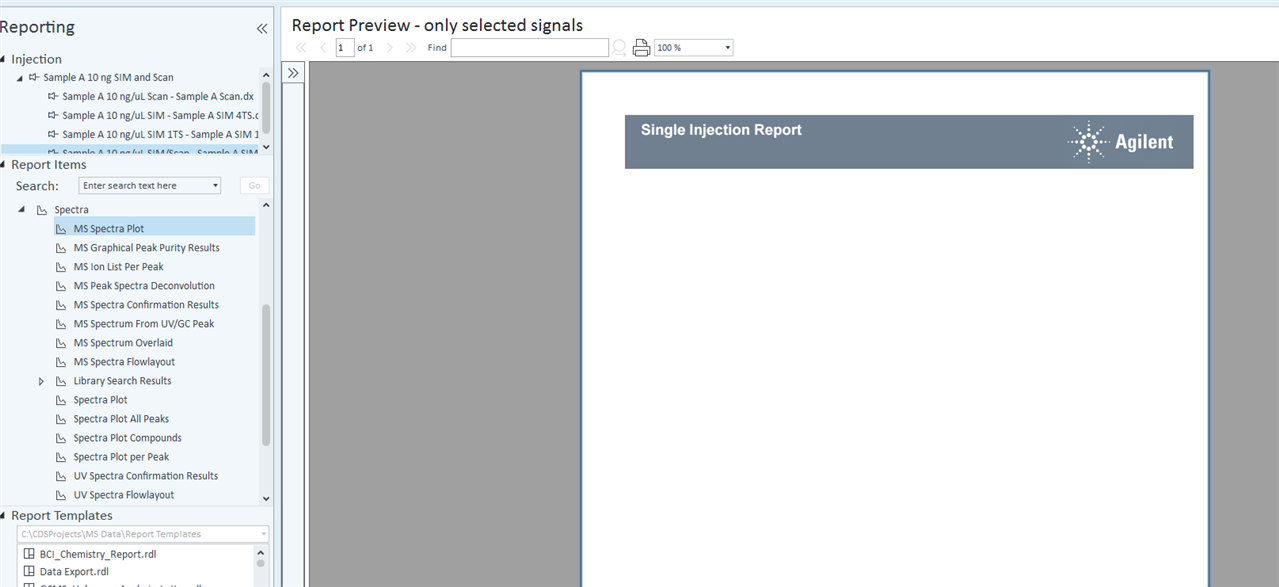
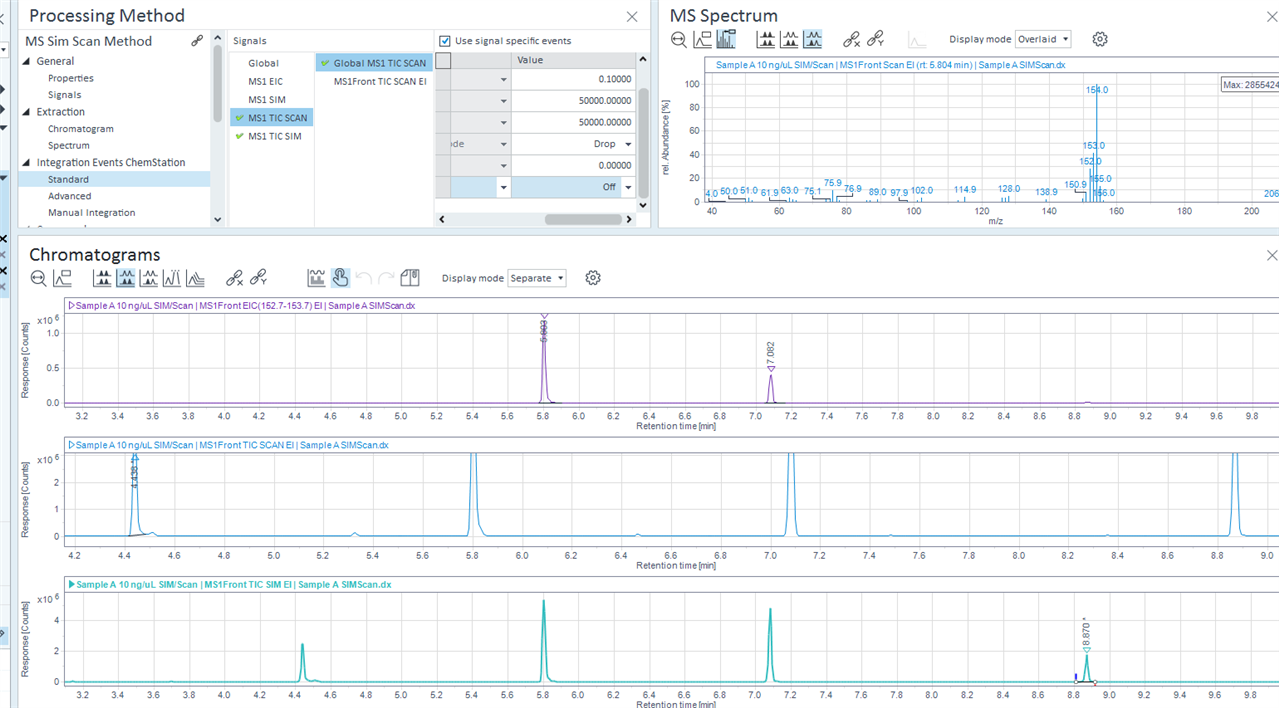
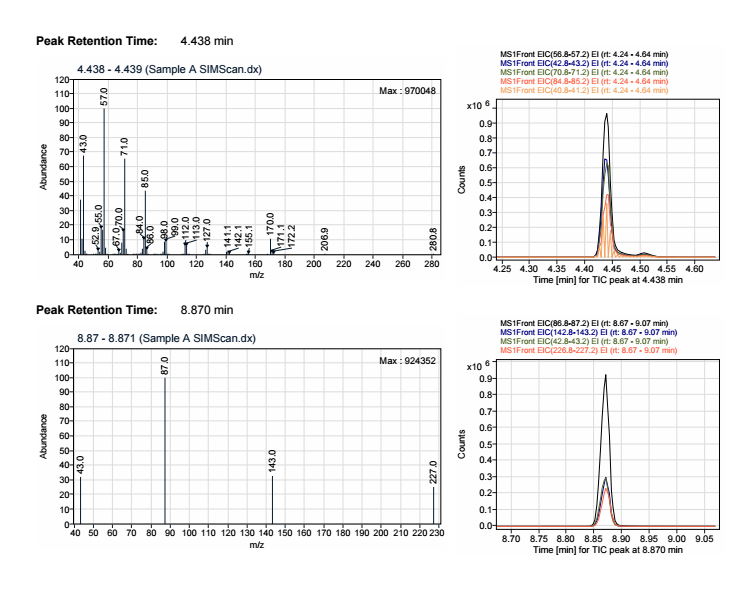
I tried to add SIM MS spectra on a openlab CDS report and I can't find how to do it. 

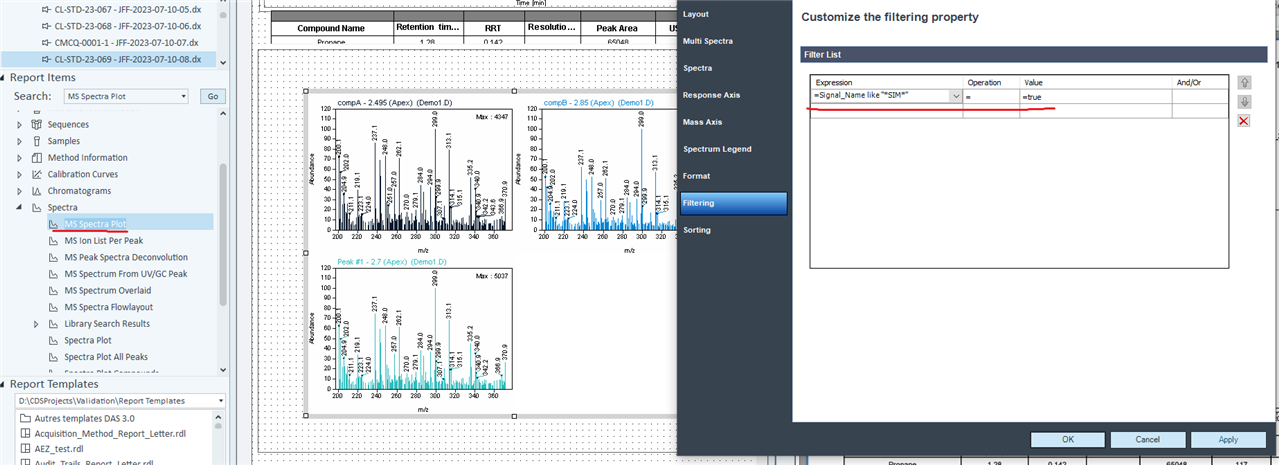
I tried to drag the standard MS spectra plot from the report item and add a filter based on the signal name without any success. No spectra as a result. 

I need help. How can I make it work. 

Thank you 

Parents Reply Children
  • Hello,

    If you have no peaks found in either the SIM TIC or SCAN TIC then you cannot report spectra in IR, even if you have peaks integrated in EIC signals. See the example below where the peaks are only found in the EIC signals. You should control the page by resizing the object or forcing page breaks after the group repetitions. 

    Peaks only in the EIC

    No spectra reported

    Peaks in TIC for SIM and SCAN. 

    Only the spectra from the peaks found in the TICs are reported. 

Was this helpful?