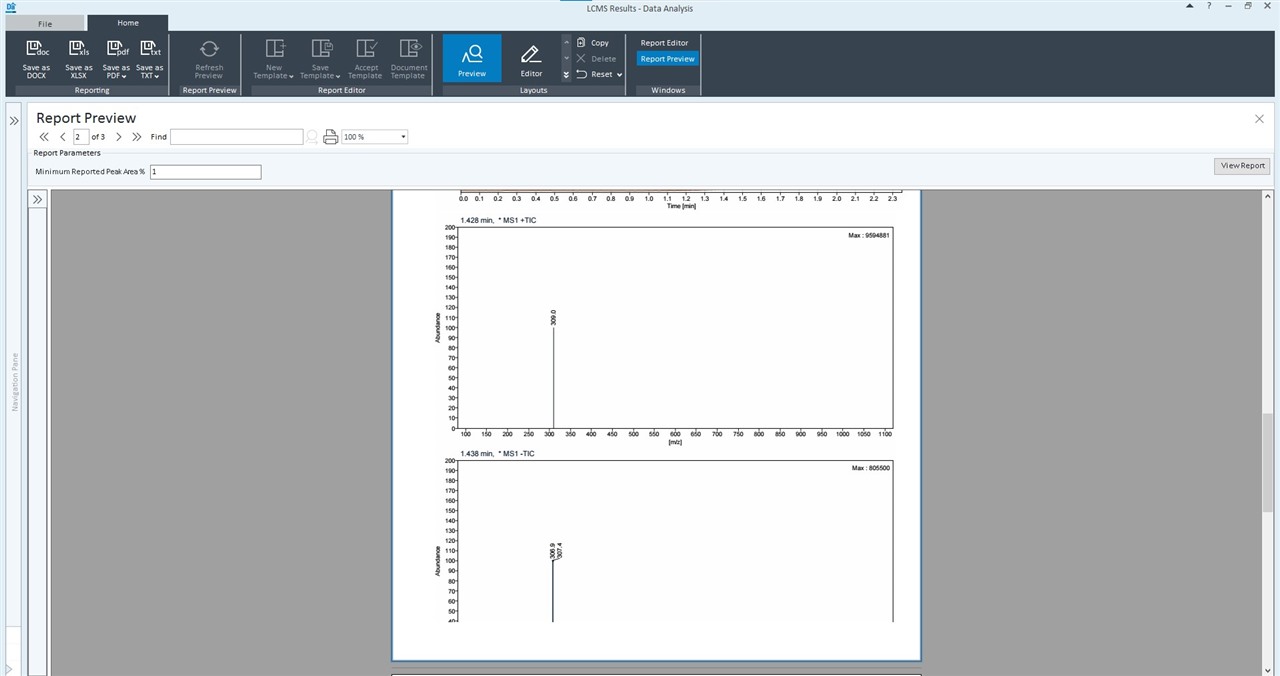
I'm trying to create a report that will scale the m/z axis to better illustrate the major ions found but I instead get the entire m/z range. Further more is there any way to stop the spectra being cut off by the page break?

I've selected "All mass axis with individual scales" under "Scaling".
Many thanks,
Francis
