When creating a report with multiple mass spectra are you able to automatically scale each spectra's m/z axis individually?

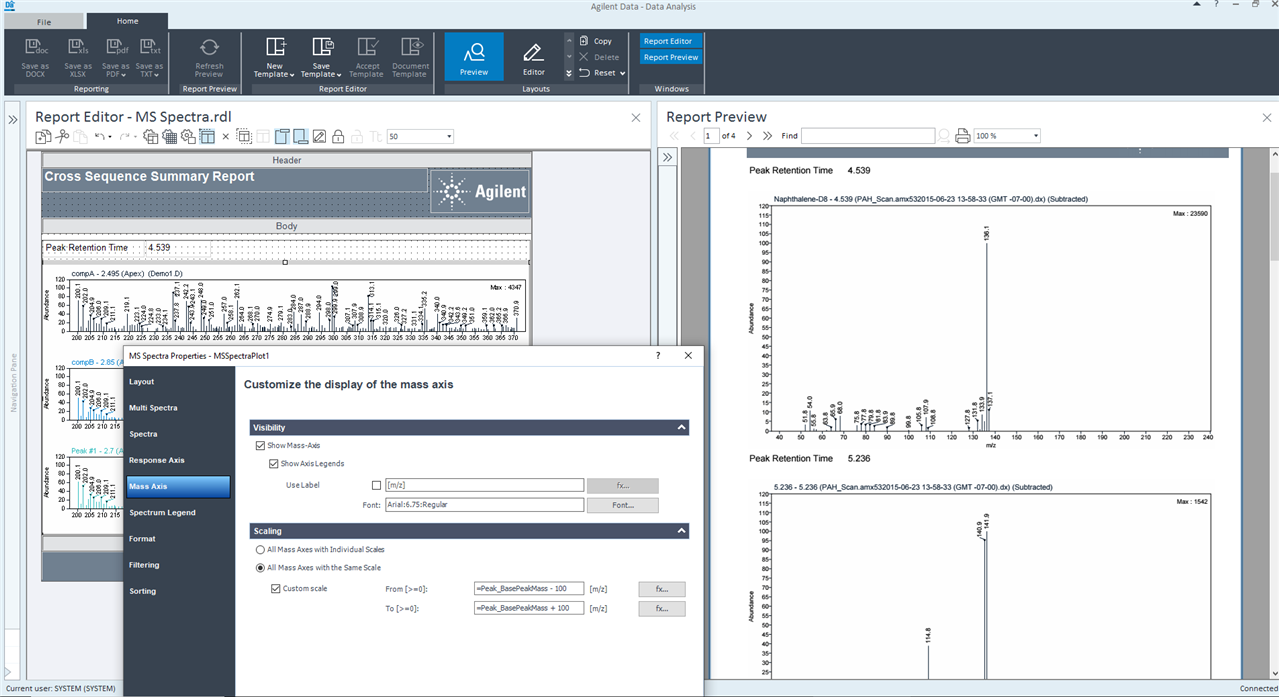
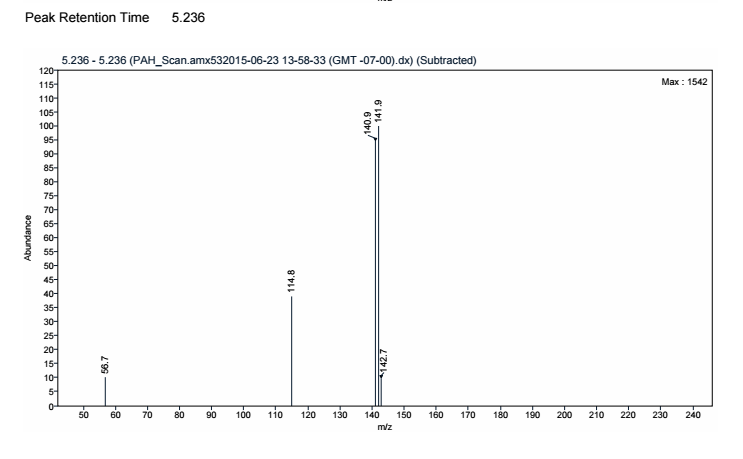
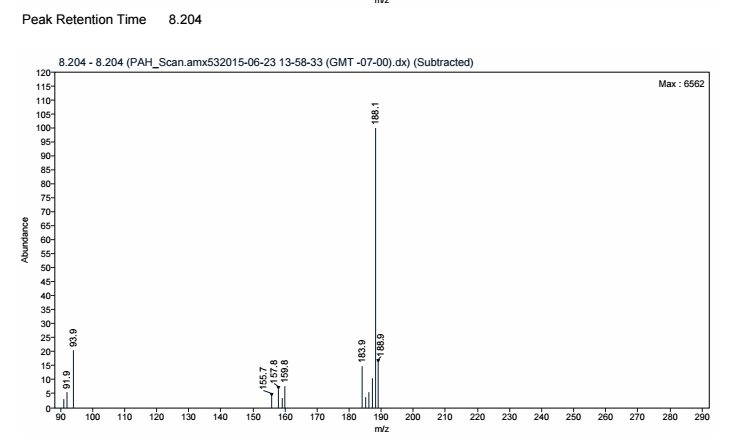
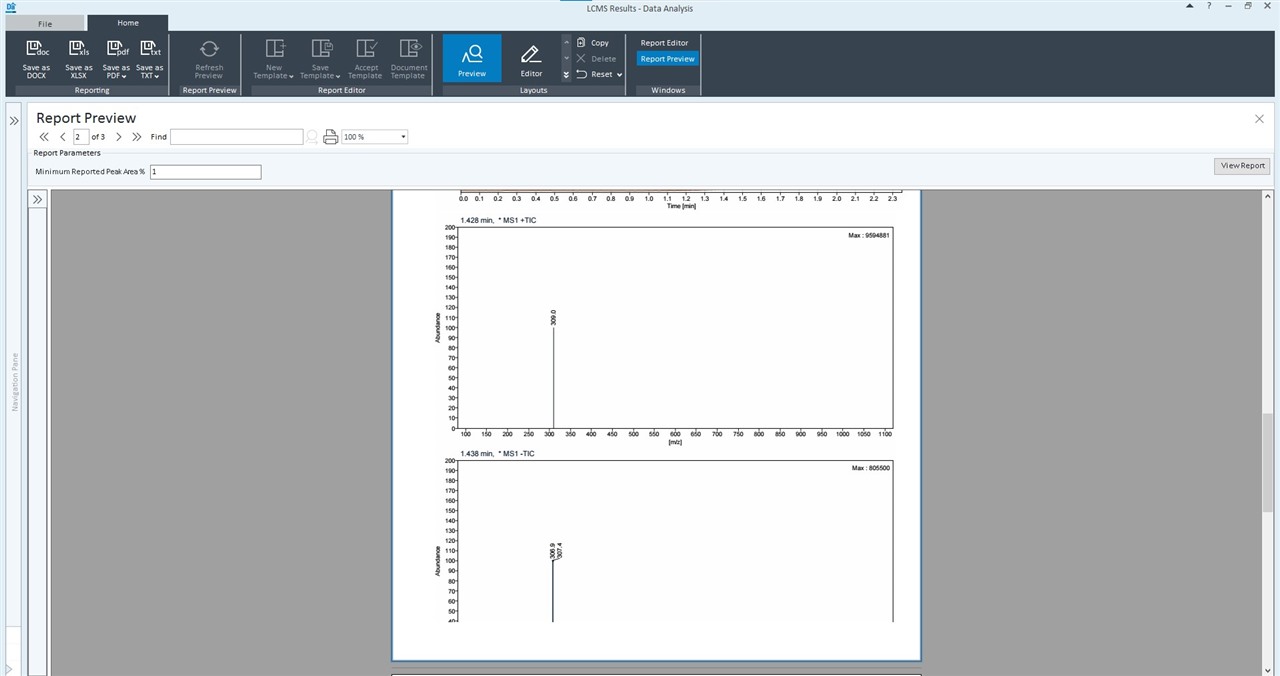
I'm trying to create a report that will scale the m/z axis to better illustrate the major ions found but I instead get the entire m/z range. Further more is there any way to stop the spectra being cut off by the page break?

I've selected "All mass axis with individual scales" under "Scaling".

Many thanks,

Francis

Parents
  • Hello,

    I would assume for the cutoff of the spectral image you made the object larger than the vertical page size. I would look at repeating the spectral object you are using by peak ID or peak RT. For the scaling there is really no way to scale the mass axis per spectra. The only option would be to scale off the m/z base peak as that is really the only value we present as a number from the spectra. You can see the example below, I repeat the spectral object by grouping with the Peak RT and then repeating by RT. I also set the Mass Axis to scale on the base peak +-100. 

    Marty Adams

Reply
  • Hello,

    I would assume for the cutoff of the spectral image you made the object larger than the vertical page size. I would look at repeating the spectral object you are using by peak ID or peak RT. For the scaling there is really no way to scale the mass axis per spectra. The only option would be to scale off the m/z base peak as that is really the only value we present as a number from the spectra. You can see the example below, I repeat the spectral object by grouping with the Peak RT and then repeating by RT. I also set the Mass Axis to scale on the base peak +-100. 

    Marty Adams

Children
Was this helpful?