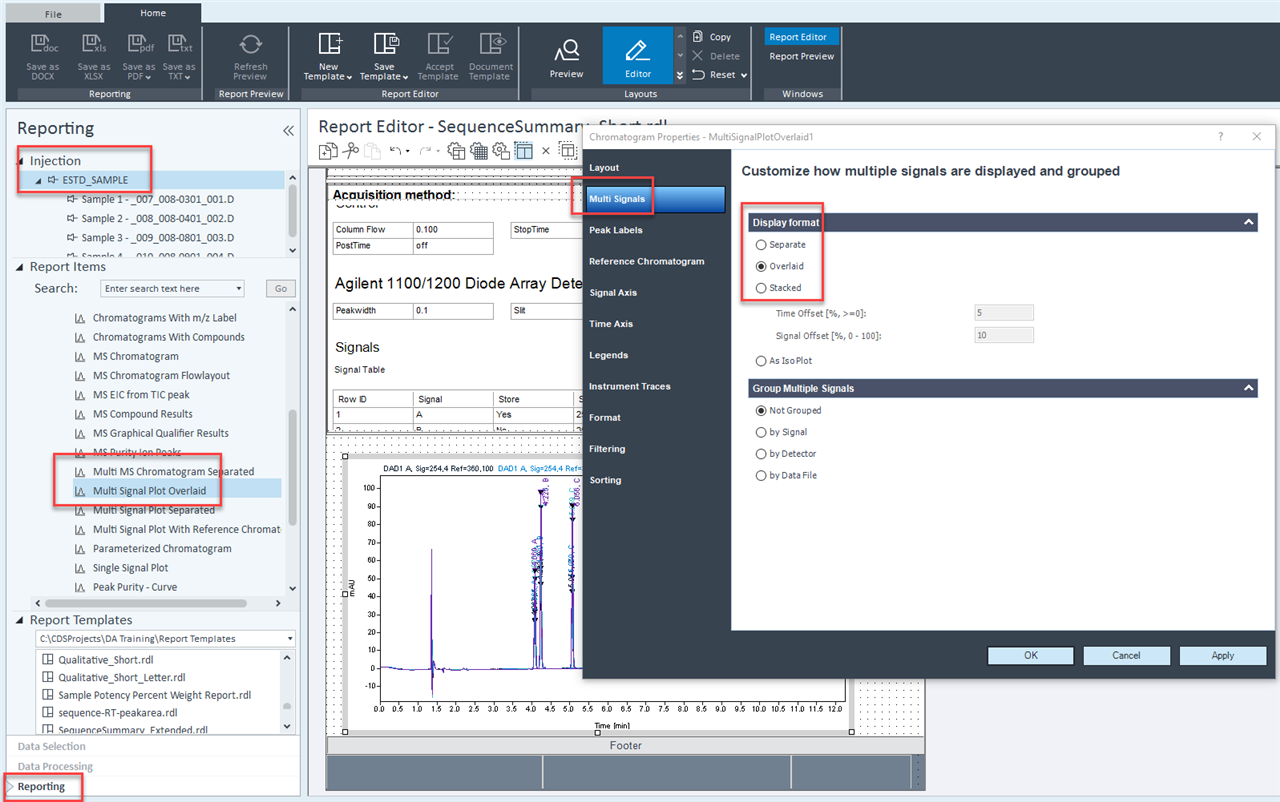
Bwsanchez If you want to overlay the chromatograms, please go to Reporting, select multiple injections or the whole sequence > select the report template, then drag the Multi Signal Plot Overlaid to the report (under Report Items > Chromatograms). You then right click on this chromatogram > select Properties > go to Multiple Signals > select Overlaid. For more details, please check out this article from Openlab Help & Learning.
Please let me know if this is what you are looking for!
We are glad this was helpful! We are sorry this was not helpful. If you still need assistance please create a community post or contact support. To help us improve, please provide any additional feedback.
For full details of how we will treat your information, please view our privacy policy.