Reporting Unknown peaks

Hi all,

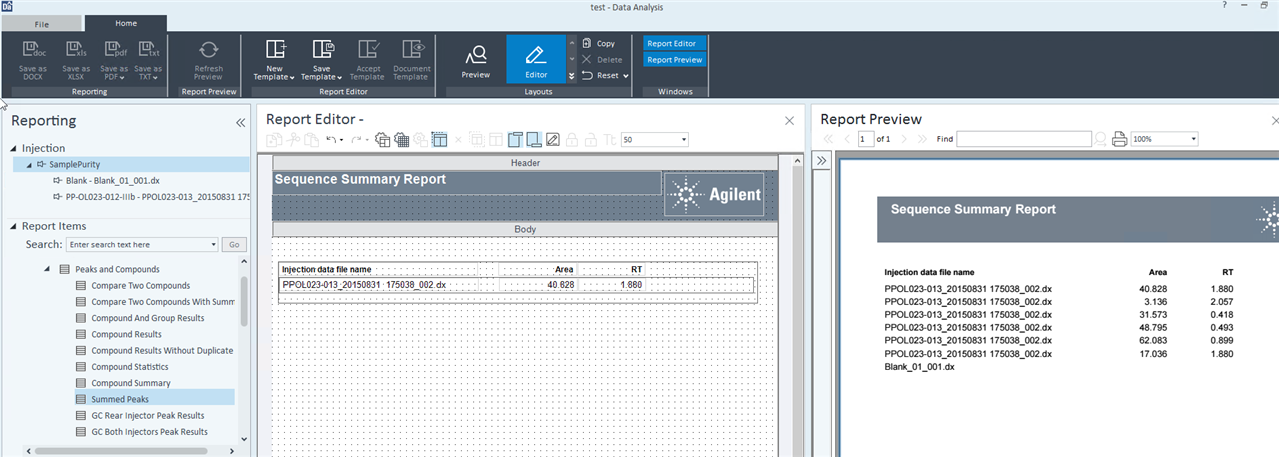
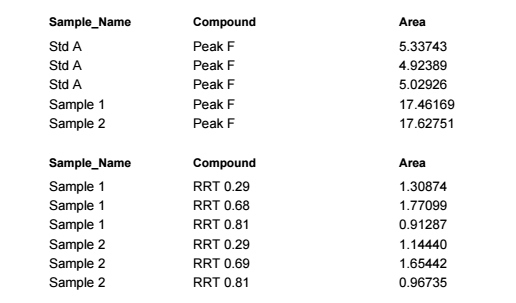
I want to create an intelligent report (Open lab 2.5) with a compound summary table to display identified peaks and a second table for unknown peaks.

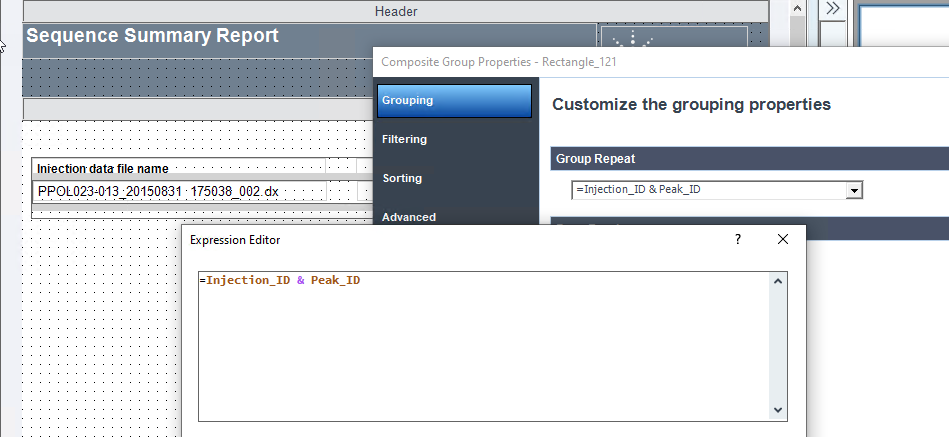
Unknown peaks come from a timed group and are named with a custom calculator using their RRT.

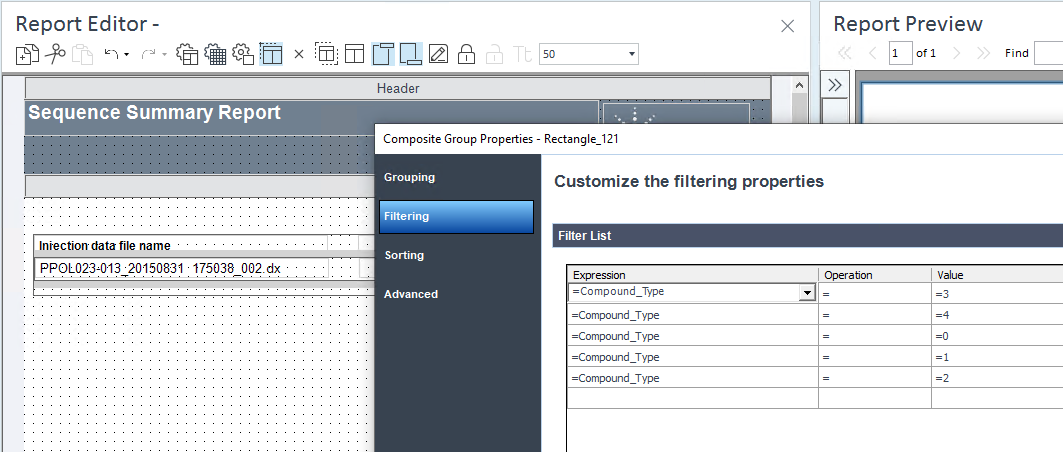
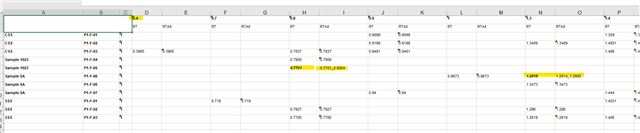
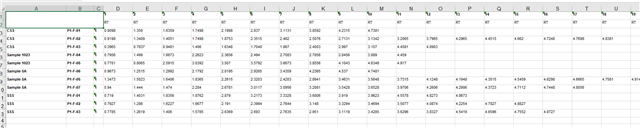
I use the peak result table from the snippet, filtered to have only unknown peaks and grouped by name (using the CC).

The compound table displays all the injections even if the compound is missing. I want the same for the unknown table. Any ideas ?

Other question: I'm using a Custom calculator to display the average surface of compound in the calibration samples of a sequence result (sequence scope). I would like it to display only once (not once for each calibration sample) or prevent repetition, how can I do this ?

Thanks

Parents
  • Hello ,

    I'm not sure what type of results you want to show in this table, but why not using the "Compound And Group Results" table?


  • Hi, thanks for your answer.

    the report does show all the results I asked for: identified and unknown. The result table for identified compound shows all the injections selected in reporting: even if the identified peak is missing I can show a line in the table saying Peak A = 0. I would like to do the same for unknown peaks.

    As it is now a table reporting unkown peak will only include the injection where this peak "exists". I would like to "force" the table to display all the sequence.

    My guess is that the report can't display an unknown peak before "knowing it exists" so I should try to collect/aggregate all the different peaks in a list and then use a result table.

  • I see. You want to have a sequence summary report for all injection lines with all the unknown peaks. 

    The usual peak or compound tables have a row grouping by Peak. If no peak, you would not have a row for the specific injection. You can use a list. A good starting point is the "Summed Peaks" snippet:

    After grouping expression modification, you can see the table reporting peaks from all injections, even if there is no peak in these injections (example here with the blank sample):


    For the row grouping, you can used nested group (a peak repeating group grouped by the injection ID), or just concatenate the group you want in the expression:

    Then you need to edit your filters:

    In my case, I report all peaks and groups. If only unknown, you can use the filter Compound_Type = 0.

    For the different enumeration values, refer to the online Help under the following section:
    Home > How To > OpenLab CDS > Report Template Editor > Dictionary > Enumerations


    Would that work for you?

    Regards,

    Pierre

  • Hi,

    thanks for your suggestions and sorry for the delay. I tried to create a report using the summed peaks as suggested but I seem to be stuck at the same point.

    For ease of use later I would like the tables for unknown peaks to be like this: (I am not sure it is possible)

    Std A RRT 0.29 0.00000
    Std A RRT 0.29 0.00000
    Std A RRT 0.29 0.00000
    Sample 1 RRT 0.29 1.30874
    Sample 2 RRT 0.29 1.14440

    ...

    Std A RRT 0.68 0.00000
    Std A RRT 0.68 0.00000
    Std A RRT 0.68 0.00000
    Sample 1 RRT 0.68 1.77099
    Sample 2 RRT 0.68 1.65442

    I think I need to "create" an expression containing all the different names in my compound column first and then use it as a group repeat. I tried with variable/aggregator but they do not work with strings.

  • Hi ,

    Ok, I see. It's a tricky one, but I may have an idea.
    Just before I respond, can you tell me from where are you taking the unknow RRT?

    From any injection?
    Meaning that if a peak shows up in one injection, the report should tell for any injection the Area of that peak if existing, or 0 if not?

    From Standard(s)? Or Samples?

    Regards,

    Pierre

  • I use this formula in the compound column: IIF(Compound_type=0, "RRT "+Left(Peak_RelativeRetTime, 4), Compound_Name)

    and yes, ideally I would like the report to show a full table (every injection and every sample type) for an unknown peak even if it is present in only one of them.

  • Hello,

    Would either of these method work for reporting your unknowns? I am using RT in the example but you could use RRT as well. The first example uses CC to round the RT to allow reporting in a Matrix by discreet RT slices. It also displays all peak RT in the slice in case more than one peak is captured. The cell also changes font type and weight to indicate the count of peaks is greater than one. This would allow you to visualize the unknowns across multiple samples within the limitation of the rounding. The other example simply indexes the unknowns in each injection and displays them by index in the table. 

    /cfs-file/__key/communityserver-discussions-components-files/26/Testing-Matrix-Index.xlsx

    /cfs-file/__key/communityserver-discussions-components-files/26/Testing-Matrix.xlsx

Reply Children
No Data
Was this helpful?