Summary table for average peak area and grouped by peak

Hello There

Is there an easy solution to the following requirement;

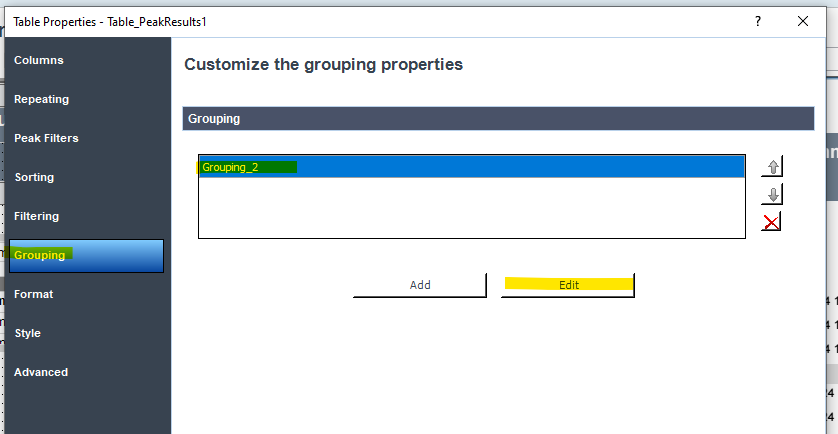
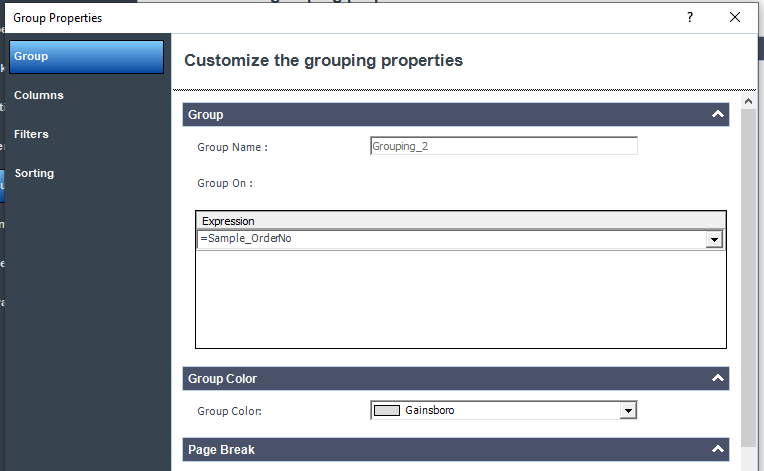
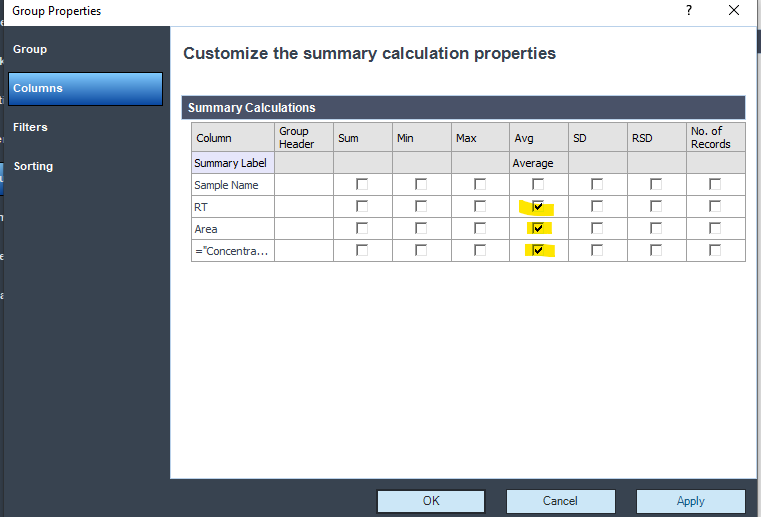
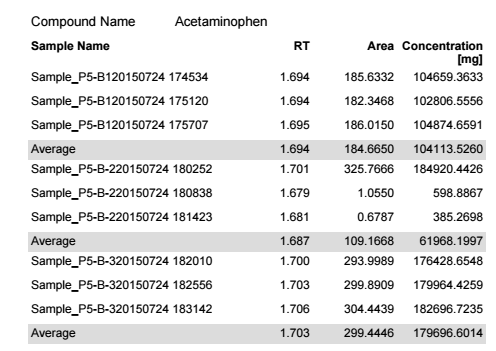
A sequence summary table grouped by compound/peak where the average peak area is reported from all replicate injections in each sequence line.


In many cases we carry out duplicate injections from each sequence line then we report the mean response for each peak and currently complete operation this in EXCEL. 


We are operating in OpenLab2.4


Thank you in advance for any feedback

Geraint

Parents Reply
  • Hello,


    The way Ryan indicated to do the custom calculation will work but depending on how you want to present the data in the table there is another option in IR. You could use an internal group in the table object. You would create and edit a group in the table. You can group by Sample_OrderNo as in the custom calculation example or you could use vial number, sample name, some another variable unique to your replicates. Once you have the group you can include calculations(average, stdev, sum, ect.) for the columns in the table. You can only display theses values, they cannot be stored for use later in the template.


Children
Was this helpful?