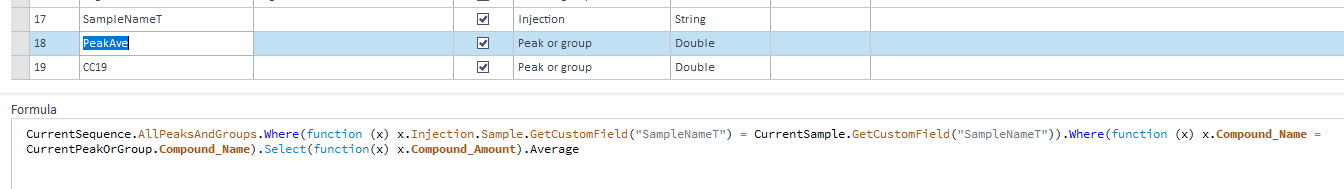
When we are running samples, we always run 2 samples of each and have a strict naming convention where they are always named "SAMPLENAME-A" and "SAMPLENAME-B". Is there a way to have the average of selected values in "-A" and "-B" be displayed? We often run 10 or more samples, each with "-A" and "-B" versions.
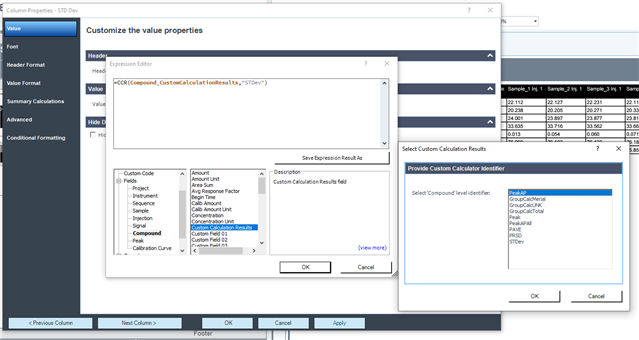
I use Custom Calculator values for many of the values.
I am not worried about how the values are displayed. I would prefer that they are displayed inline after each sample pair (as displayed on the image), but they can also be displayed after the total sample run in it's own table.
CURRENTLY: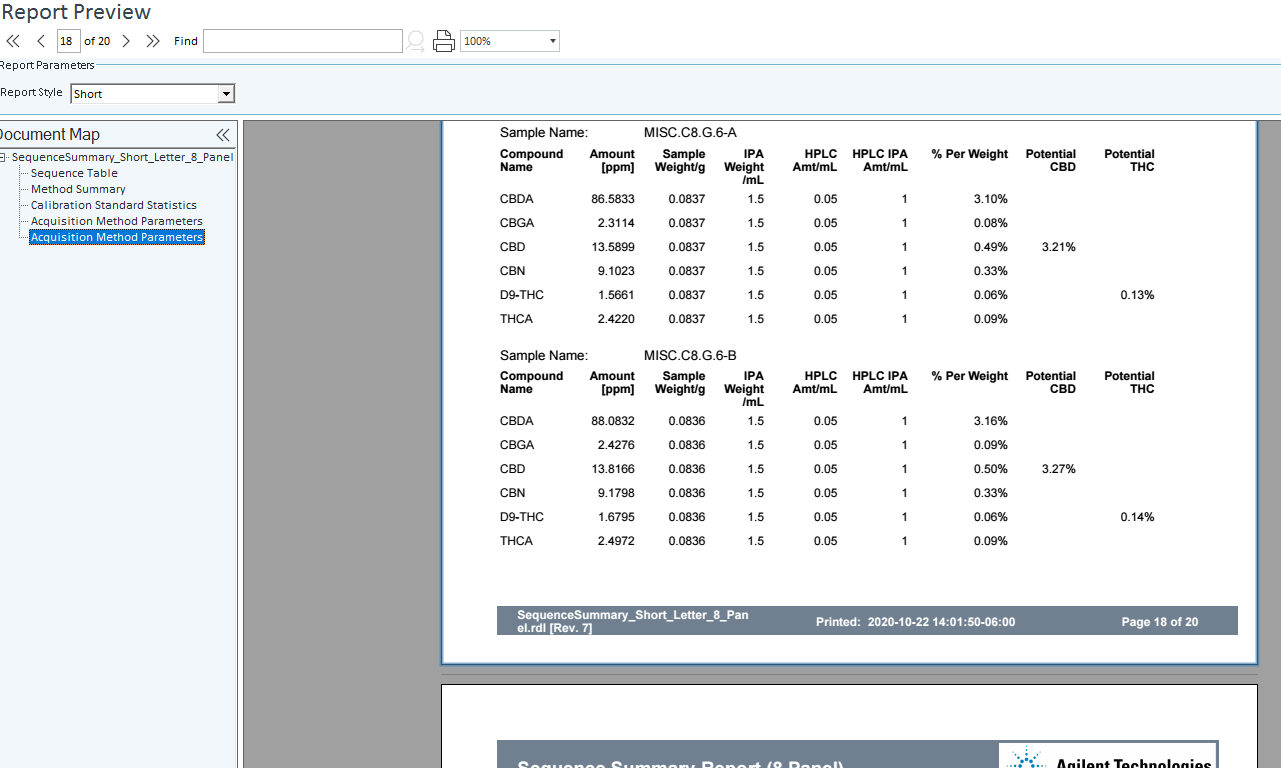
DESIRED DISPLAY:

While I am a programmer comfortable with PHP, I am not well versed with VB, and not sure how to work within the confines of the console.