Intelligent report - SEC help

Hello, 


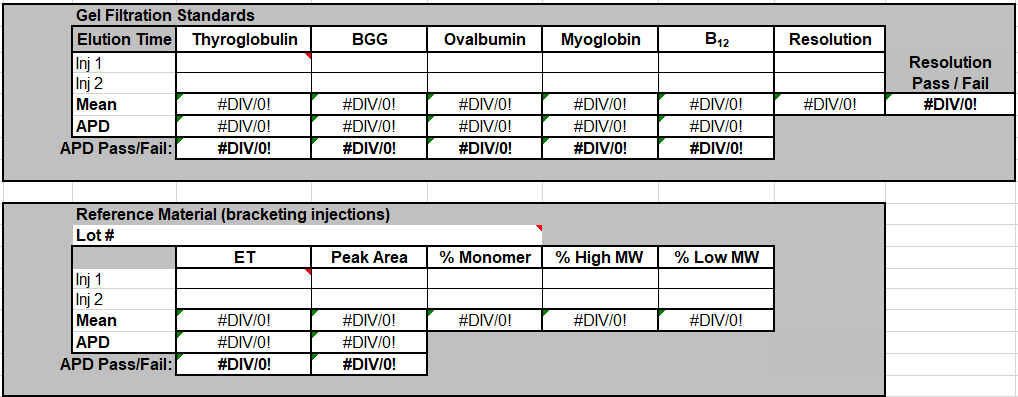
I am trying to generate a streamlined intelligent report in OpenLab where we can capture all peaks of our SEC gel filtration standard in a single table and be able to evaluate APD Pass/Fail for each peak and Resolution between BGG and Ovalbumin. An example excel table is provided below. In our current IR, each peak is being filtered into it's own table for evaluation. Is that necessary or is there a way to filter each peak as below? Any help would be greatly appreciated. Thank you.intelligent reporter table filter

 

Parents
  • Hello,


    Would you please tell us what software you are running (OpenLab CDS, OpenLab ChemStation, etc...) as well as what revision? You can determine this by going to either Help>About or File>About. 


    Also, no Excel spreadsheet was attached to your post so could you please attach it to a reply or at the very least take a screenshot of what you are referencing so that we know how you want to setup the report?

  • Hello, we have OpenLAB CDS ChemStation Edition Rev C.01.07 SR4 [510]. I had tried adding a screenshot of the excel table and it didn't show when I posted. I'll try this again. 

    Thank you!

  • Thank you for providing the the software revision and the screenshot.


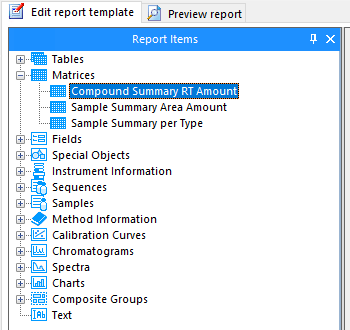
    The default report item that fits most closely with the tables you are trying to reproduce is the Compound Summary RT Amount matrix:


    Below is a screenshot of what a report template with this matrix looks like (generated with LC demo data):

    You are able to edit what results are reported for each compound and you can filter the matrix for different compounds, sample types, etc... but most of the matrix formatting cannot be edited. Hopefully that helps.

Reply
  • Thank you for providing the the software revision and the screenshot.


    The default report item that fits most closely with the tables you are trying to reproduce is the Compound Summary RT Amount matrix:


    Below is a screenshot of what a report template with this matrix looks like (generated with LC demo data):

    You are able to edit what results are reported for each compound and you can filter the matrix for different compounds, sample types, etc... but most of the matrix formatting cannot be edited. Hopefully that helps.

Children
Was this helpful?