LOD and LOQ

Hello, i'm a chemistry student and i'm trying to do a method validation.

I'm trying to calculate the LOD and the LOQ of my method, but i realize there're multiple ways to do so.

In the ICH HARMONISED GUIDELIN (2022 R2) they suggest to use this statistic approach for the LOQ and le LOD:
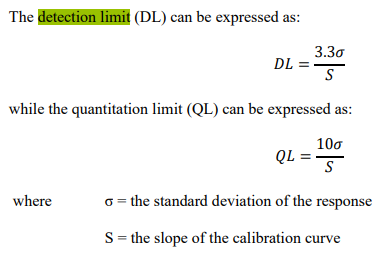
Now may i ask you if you have any paper/book where this statistic method is demonstrated? I've done plenty of research, but no one goes deep enough to explain how to obtain the "3.3" and the "10" factors. I would like to know the whole mathematical demonstration so i can argue judge better what i am using for the validation.

Sorry for disturbing you

and thank you even if you can't answer!

Parents
  • Hello i found this online

    credits goes to the Lösungsfabrik site

    If you ever wondered why the limit of detection (LOD) is actually calculated using the formula

    LOD = 3.3 x standard deviation / slopecalibration curve

    and where the 3.3 actually comes from, this article may shed some light on the subject.


    The whole thing is based on a concept of probabilities. One could postulate as null hypothesis that the result of a sample with a very low analyte concentration is not statistically different from the blank and verify this applying a t-test.

    Therefore, if we think the other way around, the detection limit is also defined as that smallest analyte concentration whose surrounding 95% confidence interval does not overlap with the blank [1]. It is therefore the analyte concentration that can be reliably distinguished from the Limit of Blank (LOB).

    The LOB is the analyte concentration below which 95% of the measurement signals are found when a blank sample is measured repeatedly. The remaining 5% represent false-positive signals (i.e. signals which simulate a very low concentration of an analyte in the sample although no analyte is present), statistically speaking the α-error. A probability of α = 0.05 (= 5%) yields a one-sided Student t-value of 1.65 (with infinite degrees of freedom). Thus, the LOB is calculated as follows LOB = meanBlank + 1.65 x standard deviationBlank [2]. All values above the LOB should be declared as being positive.

    In the case that the true value of the analyte concentration of a sample would be exactly at the LOB, this would mean that 50% of the measurement results would be below the LOB, which would correspond to a 50% risk of error for false-negative results. Since this is not very practical, the β-error (i.e., the occurrence of false-negative results) is therefore also assumed to be 5%, analogous to the α-error. These 5% again correspond to a one-sided Student t-value of 1.65 and the limit of detection must therefore be 1.65 x standard deviation above the LOB, which then results in the total factor of 1.65 + 1.65 = 3.3 x SD.

    This sounds all good and we accept it as such, but without worrying about the degree of freedom, because of course we do not measure our blank infinitely often. For this reason, the Eurachem Guide mentions that "for a statistically rigorous estimate of the detection limit, the multiplication factor used should take into account the number of degrees of freedom associated with the estimate of the standard deviation" and explains with an example that 10 repeated measurements (i.e. 9 degrees of freedom) result in a Student t-value of 1.83 for α = 0.05 and the limit of detection is therefore calculated as 3.7 x SD [3].

Reply
  • Hello i found this online

    credits goes to the Lösungsfabrik site

    If you ever wondered why the limit of detection (LOD) is actually calculated using the formula

    LOD = 3.3 x standard deviation / slopecalibration curve

    and where the 3.3 actually comes from, this article may shed some light on the subject.


    The whole thing is based on a concept of probabilities. One could postulate as null hypothesis that the result of a sample with a very low analyte concentration is not statistically different from the blank and verify this applying a t-test.

    Therefore, if we think the other way around, the detection limit is also defined as that smallest analyte concentration whose surrounding 95% confidence interval does not overlap with the blank [1]. It is therefore the analyte concentration that can be reliably distinguished from the Limit of Blank (LOB).

    The LOB is the analyte concentration below which 95% of the measurement signals are found when a blank sample is measured repeatedly. The remaining 5% represent false-positive signals (i.e. signals which simulate a very low concentration of an analyte in the sample although no analyte is present), statistically speaking the α-error. A probability of α = 0.05 (= 5%) yields a one-sided Student t-value of 1.65 (with infinite degrees of freedom). Thus, the LOB is calculated as follows LOB = meanBlank + 1.65 x standard deviationBlank [2]. All values above the LOB should be declared as being positive.

    In the case that the true value of the analyte concentration of a sample would be exactly at the LOB, this would mean that 50% of the measurement results would be below the LOB, which would correspond to a 50% risk of error for false-negative results. Since this is not very practical, the β-error (i.e., the occurrence of false-negative results) is therefore also assumed to be 5%, analogous to the α-error. These 5% again correspond to a one-sided Student t-value of 1.65 and the limit of detection must therefore be 1.65 x standard deviation above the LOB, which then results in the total factor of 1.65 + 1.65 = 3.3 x SD.

    This sounds all good and we accept it as such, but without worrying about the degree of freedom, because of course we do not measure our blank infinitely often. For this reason, the Eurachem Guide mentions that "for a statistically rigorous estimate of the detection limit, the multiplication factor used should take into account the number of degrees of freedom associated with the estimate of the standard deviation" and explains with an example that 10 repeated measurements (i.e. 9 degrees of freedom) result in a Student t-value of 1.83 for α = 0.05 and the limit of detection is therefore calculated as 3.7 x SD [3].

Children
No Data
Was this helpful?