merge all datas of a sequence in a single excel file

Hello

I  would like to merge data form several chromatogramm (sequence) in a single excel file to have

date / time / and area n, retention time etc

I have reproceesed the whole sequence and each data of analysis is stored in a single excel file encapsulated in a single folder

Is there an option somehwere ?  Does someone own a macro to do that ?

Thanks a lot for your help.

Parents
  • Hello,


    Would you mind providing more information on what software product and revision of that software product it is that you are using? You can usually find this information by going to the 'Help' dropdown menu and selecting the option for 'About'.

  • Hello


    Software  is Chemstation B.0402 SP1 (208)


    Thanks for your interest


    [edited for content]

  • Hello,


    In ChemStation rev B.04.02 SP1, you would need to use batch reporting to generate a summary Excel file for your entire sequence.


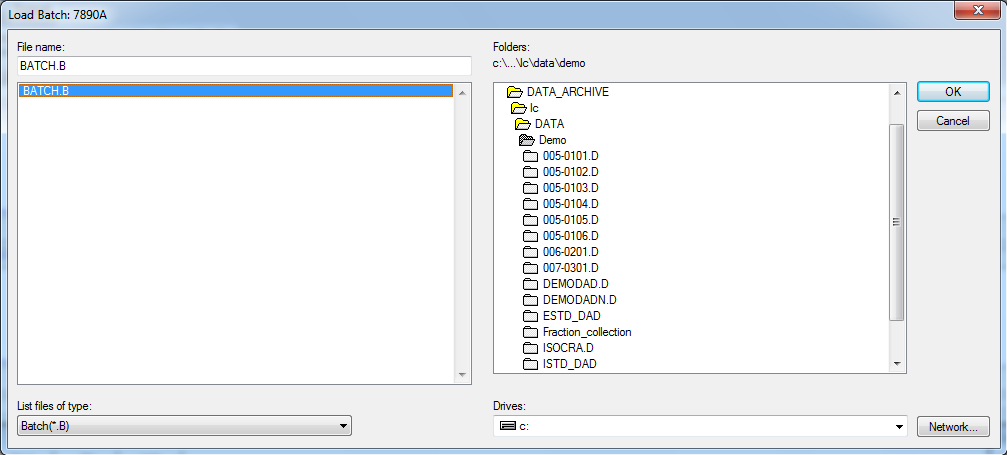
    To enter Batch Review, you will need to go to 'Batch' > 'Load Batch...'. The software will then prompt you to load a batch (.B) file, as seen below:


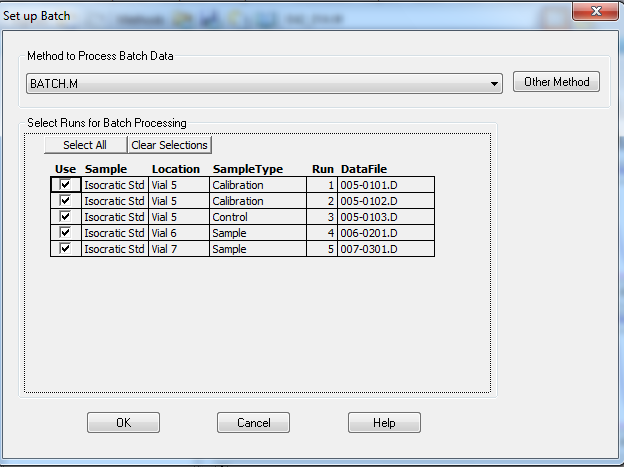
    Batch files are saved automatically in your result set folder and will have the same name as the sequence template that was used to collect that result set (but will have a .B extension, not a .S). Once select the correct batch file for your sequence, click 'OK' and you will then need to select a method and the data files you want to process/report (below):


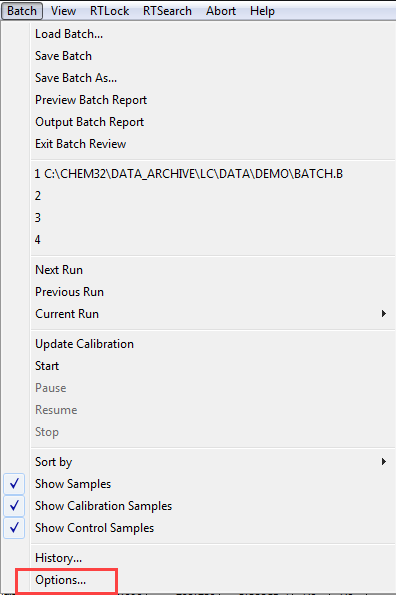
    Once you press 'OK' in the above window, you will then be able to update the Batch Options by going to 'Batch' > 'Options...':


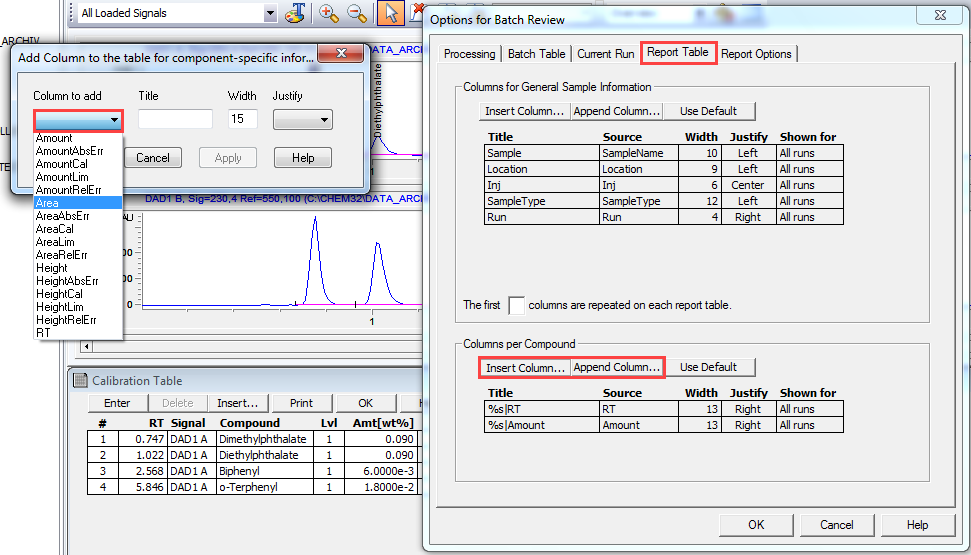
    You can update what information you want to show up in the Batch Report from the 'Report Table' tab in the Options window. For example, if you want to report the area for each of your compounds, you can insert or append a column as shown below:


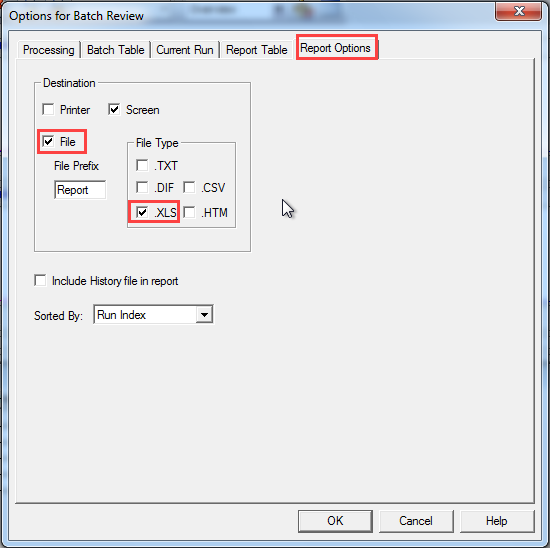
    In the 'Report Options' tab you can then specify that you want to print the report to a file and specify the file type as .XLS:


    NOTE: In the processing tab you will probably want to change the option for pausing between processing of runs from 10 seconds to 1 second to speed up the processing time.


    You can then save the batch (I recommend saving the batch file as a new name after making your changes) and then process the batch (Batch>Start) and print the report (Batch>Output Batch Report) andthe Excel batch report will then be created in the result set directory (where your data files are saved).


    Hopefully this is helpful. Please let us know if you have any questions.

Reply
  • Hello,


    In ChemStation rev B.04.02 SP1, you would need to use batch reporting to generate a summary Excel file for your entire sequence.


    To enter Batch Review, you will need to go to 'Batch' > 'Load Batch...'. The software will then prompt you to load a batch (.B) file, as seen below:


    Batch files are saved automatically in your result set folder and will have the same name as the sequence template that was used to collect that result set (but will have a .B extension, not a .S). Once select the correct batch file for your sequence, click 'OK' and you will then need to select a method and the data files you want to process/report (below):


    Once you press 'OK' in the above window, you will then be able to update the Batch Options by going to 'Batch' > 'Options...':


    You can update what information you want to show up in the Batch Report from the 'Report Table' tab in the Options window. For example, if you want to report the area for each of your compounds, you can insert or append a column as shown below:


    In the 'Report Options' tab you can then specify that you want to print the report to a file and specify the file type as .XLS:


    NOTE: In the processing tab you will probably want to change the option for pausing between processing of runs from 10 seconds to 1 second to speed up the processing time.


    You can then save the batch (I recommend saving the batch file as a new name after making your changes) and then process the batch (Batch>Start) and print the report (Batch>Output Batch Report) andthe Excel batch report will then be created in the result set directory (where your data files are saved).


    Hopefully this is helpful. Please let us know if you have any questions.

Children
  • Hi,

    This was very instructive, thank you. We did a run of all samples in the sequence as "samples," without "calibration" samples. The problem is that the batch process excel file we generated does not really contain any meaningful data (no RT, peak area etc) even though it was specifically set in the Batch -> Options -> Report Table to show RT, area and %amount. Is there a workaround through this? Would really appreciate the help! Our software is rev. C.01.07 [27]. Thanks!

  • Hello! I would say make sure that the method you are using for data processing is both set to integrate peaks (to give you peak areas) and calibrated (to give amounts).

  • Hi there, thanks for your reply. Will you be able to point me out to the right direction on how to double check that the method I'm using for data processing is both set to integrate peaks and calibrated? The only thing I really want to do is batch process my one sequence file with both retention times and peak areas. We just did the run of all samples in the sequence as "samples" without "calibration" samples. When I batch processed that, the excel file I generated didn't really contain any information. 

  • Unfortunately, it's been a few years since I've had any of these versions on my system, so I can't give you step-by-step instructions, but I believe one of my colleagues should be able to help. The gist is that if you're doing batch processing, you'll see that you're prompted for a method to use for that processing (second screenshot from above). That method should have both appropriate integration parameters and have a calibration table in order to get both areas and amounts in your report. , or others, can you help point in the right direction? 

Was this helpful?