Agilent Community
Agilent Community
  • User
  • Site
  • Search the Community
  • User
  • Home
  • Technical Areas
    Technical Areas
    • AssayMap
    • Atomic Spectroscopy
    • Automated Electrophoresis
    • Cell Analysis
    • Consumables
    • CrossLab Connect
      CrossLab Connect
      • Service Management
      • Smart Alerts
    • Dissolution
    • GC
    • GC/MS
    • iLab Operations Software
    • LC
    • LC/MS
    • Life Sciences Reagents
    • Molecular Spectroscopy
      Molecular Spectroscopy
      • Molecular Spectroscopy - UV-Vis & UV-Vis-NIR, FTIR, Raman & Fluorescence
      • 8700 LDIR User Group
      • Transmission Raman User Group
    • Real-Time PCR (qPCR)
    • Sample Preparation
    • Software
      Software
      • Chromatography Software
        OpenLab CDS, OpenLab ChemStation, OpenLab EZChrom
      • Data Management Software
        OpenLab ECM, OpenLab ECM XT, OpenLab Server
      • Mass Spectrometry Software
        Data Analysis, Data Acquisition, Productivity App, WalkUp Software
    • Vacuum
  • Applications Areas
    Applications Areas
    • Basic Research
    • Energy and Chemicals
    • Environmental
    • Food and Agriculture
  • Agilent Knowledge Portal
  • Links
    Links
    • Collection of Support Resources
    • Webinar Notifications
    • Contact Support
    • User Contributions
  • Getting Started
    Community Help and Resources
  • Browse
    Browse
    • People
    • Places
    • Your View
    • Your Community Inbox
Chromatography Software
  • Technical Areas
Chromatography Software
Wiki How to ... auto-extract signals from a UV iso-absorbance plot
  • Announcements
  • Forum
  • Articles
  • Videos
  • Wiki
  • More
  • Cancel
Actions
  • Share
  • More
  • Cancel
Table of Contents
  • +Software Collection of Resources
  • 7694B Headspace Sampler Software Support
  • Another calibration report for OpenLAB CDS ChemStation
  • Another calibration report for OpenLAB CDS EZChrom
  • Autostart macro failed error 999 in OpenLAB CDS ChemStation
  • Belarc Advisor for PC Profiling
  • Calculate date and time differences - Save date and time in IR
  • Calibration History Report (OpenLAB CDS)
  • Chemstation .CSV generation Decimal Places
  • Chemstation Chemmain Error During Startup
  • ChemStation Scheduler Commands
  • OpenLab CDS and Windows 7 Podcast
  • Computer Maintenance
  • Configuring OpenLAB CDS Chemstation for a 6890 with 3rd party detector
  • Connection to selected server failed Error 1068 - dependency service failed
  • DAMethod Register Export
  • Error Message "No Signals Available" appears when loading data
  • Error Message: Vial Range -1 to -1 - OpenLAB CDS Chemstation
  • Error: No Export File Selections Made Yet - OpenLAB CDS Chemstation
  • How to .. hide a table row based on a calculated value (OpenLAB CDS Intelligent Reporting)
  • How to ... add a percent sign to a PRSD number.
  • How to ... add LC diagnostic data to Intelligent Reports (OpenLAB CDS Intelligent Reporting)
  • How to ... add several comments to your report template without generating extra space on the report (OpenLAB CDS Intelligent Reporting)
  • How to ... align text boxes to the editor's grid (OpenLAB CDS Intelligent Reporting)
  • How to ... align uncalibrated peaks in 2 or more signals
  • How to ... auto-extract signals from a UV iso-absorbance plot
  • How to ... calculate summary statistics on computed numbers
  • How to ... calculate with a specific mutiplier or dilution factor generated by OpenLAB CDS EZChrom
  • How to ... filter for EZChrom run types QC Standard  (OpenLAB CDS Intelligent Reporting)
  • How to ... populate the template editor with your data
  • How to ... print ChemStation's live system values (OpenLAB CDS Intelligent Reporting)
  • How to ... report the number of repeated injections with OpenLAB CDS EZChrom
  • How to ... report the output of a category aggregator  (OpenLAB CDS Intelligent Reporting)
  • How to ... store a date stamp as a variable? (OpenLAB CDS Intelligent Reporting)
  • How to ... use external report parameters (OpenLAB CDS Intelligent Reporting)
  • How to ...  setup an array of compound specific parameters
  • How to configure Agilent GC headspace system within Waters Empower and ICF
  • How To Overlay Chromatograms in OpenLab ChemStation
  • How to... report sequence related customized parameters (OpenLab ChemStation Intelligent Reporting)
  • HowTo : Report the n Biggest Peaks of a sample analysis (OpenLab CDS Custom Calculator)
  • KB: Useful Free Third-Party Software Tools
  • Little script to print Text and Numbers as Results ( e.g. below detection limits ) (OpenLAB CDS Intelligent Reporting)
  • LookInMyPC - PC Profiling and Diagnostics
  • Make your own custom way of displaying the Date and Time in your reports
  • Migrating from OpenLAB CDS EZChrom Edition to OpenLab CDS Version 2.3 – Workstation to Workstation
  • MSD Error: HPMSAXQ0.DLL failed upon launching Openlab - OpenLAB CDS Chemstation
  • Notepad++
  • Openlab CDS C.01.07 and 6890 classic driver
  • Reprocessing data using a new calibration table
  • Sequence Aborted Due to File Access Error - OpenLAB CDS Chemstation
  • Sequence container/result set data will not load in navigation panel - OpenLAB CDS Chemstation
  • Video Series: OpenLab CDS for ChemStation Users
Still Need Help?

Post your question in our User Forum or Contact Support.

How to ... auto-extract signals from a UV iso-absorbance plot

Created by betrich betrich over 3 years ago | Last modified by kristen.sensabaugh kristen.sensabaugh over 2 years ago

In order to extract a chromatogram at any collected wavelength you could use the procedure below.

Caution: The wavelength specific data density of the UV file is typically smaller compared to a single signal file. This typically results in a lower S/N ratio and it's not recommended to use such extracted signals for quantification.


  • In Data Analysis view got to menu Spectra > Isoabsorbance plot
  • Extract the signal from iso-absorbance by changing the cursor to “signal” and enter the wavelength and bandwidth setting.  This will activate the COPY button

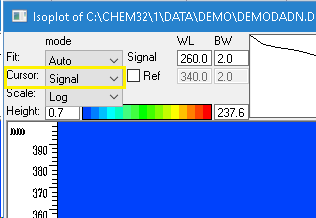
  • Press the Copy button and close the iso-absorbance plot window
  • Integrate the extracted chromatogram
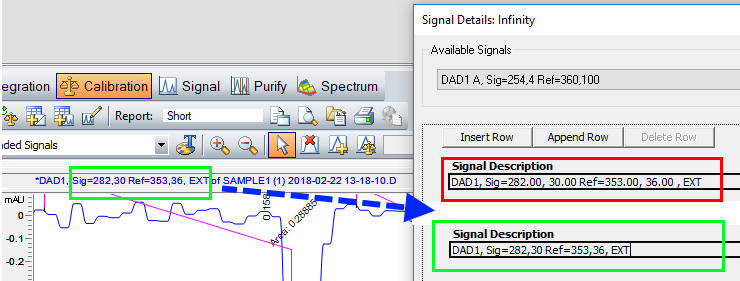
  • Calibrate the extracted signal (this action will copy the correct syntax to Calibration > Signal Details)
  • Delete the calibration table, in case you don’t need it. The Signal Details are kept.

When loading another data file and the View > Preferences are set to "Load signals using signal details", the chromatogram gets automatically extracted when loading a data file with appropriate spectral data


Note: If you aim to use the calibration table for compound indentification or quantification, you need to ensure the signal description shown in the signal details window matches the signal description in the header of the chromatogram window.  For certain UV detectors you need to manually shorten wavelength numbers as shown below.  After all, quantifications based on extracted signals need to evaluated very carefully due to the reduced signal/noise ratio and its impact on quantification precision.


  • software
  • ChemStation for LC
  • ChemStation
  • Share
  • History
  • More
  • Cancel
  • Sign in to reply
Was this helpful?
  • Yes
  • No
Thank you for your feedback!

Agilent Community Feedback

Agilent Community Feedback

×
We are glad this was helpful! We are sorry this was not helpful. If you still need assistance please create a community post or contact support. To help us improve, please provide any additional feedback. For full details of how we will treat your information, please view our privacy policy.
Submit Cancel
Submit Cancel
Related
Privacy Statement
Terms of Use
Contact Us
Site Help