chromatogram intelligent report custom calculation

Hello,
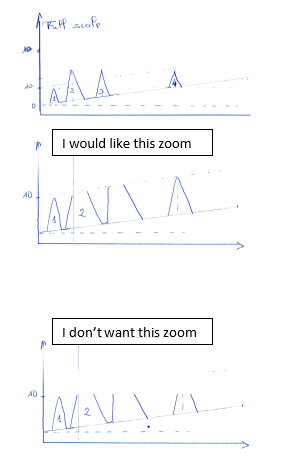
I need help with the creation of a zoom lens.
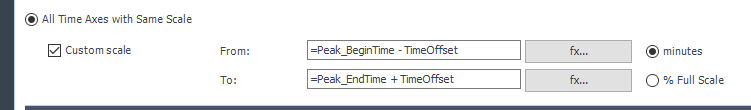
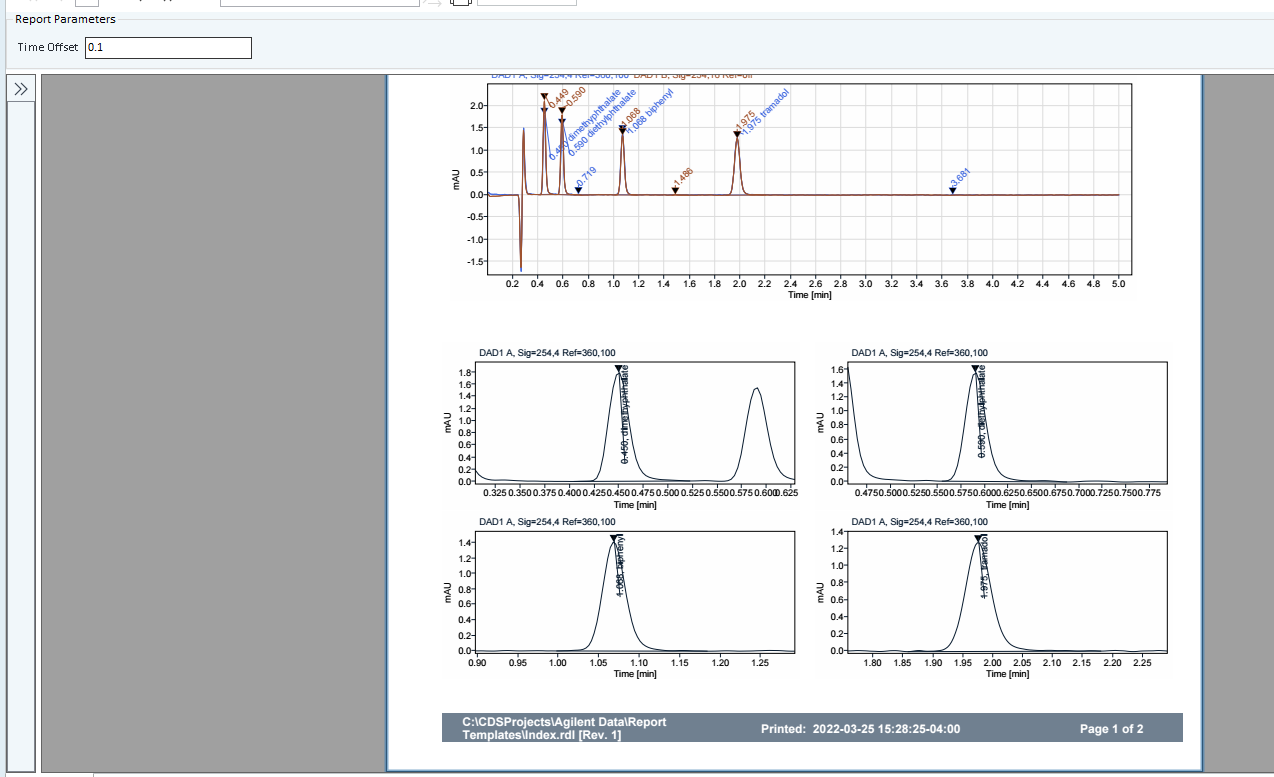
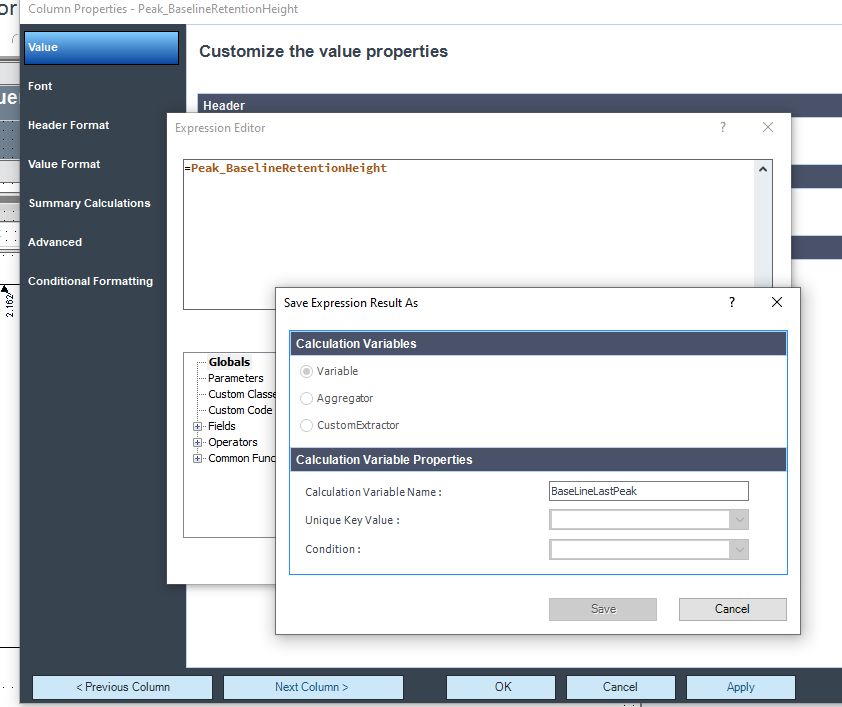
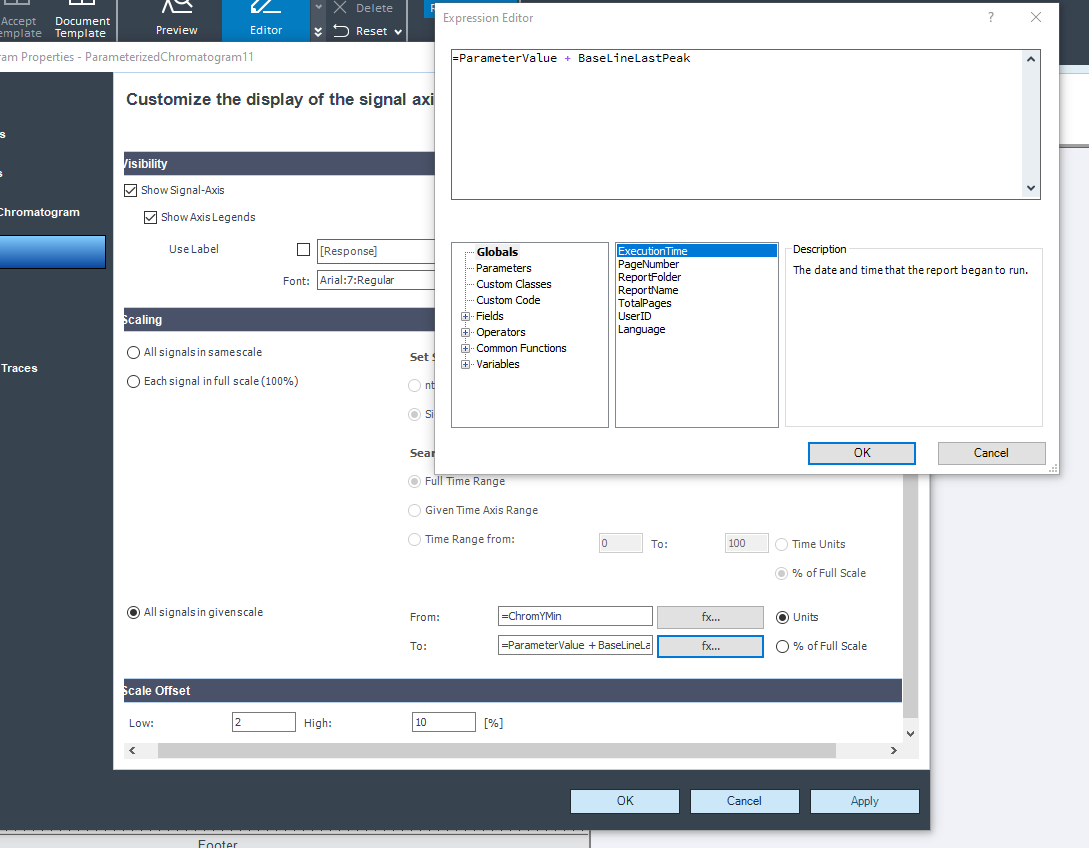
I would like to use all signals in given scale.
How should I set "To", so that it takes into account the drift of the baseline.
And for "from": maximum height of the compound1 peak.
Thanks for your help

SYB

Parents
  • Hello,

    I am not exactly sure what you are doing but here is an example of scaling in the Chromatogram. I used the scaling below to get the example report with the scaled chromatogram of the peaks of interest. The repetition in the example is more complicated. I added an external parameter so the user could modify the time scale. 

    Marty Adams

    Signal

    From =Val(If(Peak_LevelStart < Peak_LevelEnd, Peak_LevelStart,Peak_LevelEnd))

    To =  =Peak_Height

    Time

  • hello,

    My question was incorrect, I reversed from and to

    How can I get a zoom that has the same height as peak 1 and takes into account the drift of the baseline?
    BELOW is an example of what I would like.

    Thanks for your help,

    SYB

  • Hello,

    You cannot can find the drift specifically you would need to have a peak near the end of the chromatogram. Here is an example where I hid 2 tables at the top of the report. In one table, I stored the height of the peak of interest as a variable and the other I stored the baseline at RT of the last peak as a variable. Then I used those as the scaling for the Y axis by adding them together. You can see the change in the scale in the report. The top chromatogram is scaled against the height of the target peak and the second is the same plus the baseline level of the last peak.

    Marty Adams

Reply
  • Hello,

    You cannot can find the drift specifically you would need to have a peak near the end of the chromatogram. Here is an example where I hid 2 tables at the top of the report. In one table, I stored the height of the peak of interest as a variable and the other I stored the baseline at RT of the last peak as a variable. Then I used those as the scaling for the Y axis by adding them together. You can see the change in the scale in the report. The top chromatogram is scaled against the height of the target peak and the second is the same plus the baseline level of the last peak.

    Marty Adams

Children
Was this helpful?