How can I export the peak area percentages of several hundred samples from OpenLab to excel?

I have a set of ~500 samples taken by an Agilent 990 Micro GC running continuously. I'm using an integration method (which I didn't write) to get the peak areas for each sample, and I combined those results into a resultset, but I can still only view the peak areas of one sample at a time within the result set. I can export the peak area tables for each sample by right clicking the table and clicking "export", but trying to do the same with the entire resultset doesn't seem to be working. How can I export all of the data simultaneously? Optimally I could get this in a format with each identified compound in its own column with its peak area being listed against either sample number or time.

Parents Reply Children
  • Have you tried a summary report?  These are used to report on an entire result set.  You should be able to save one of the canned summary report templates w/ a new name and tweak it to achieve what you've mentioned above.

  • This is how I've got around a similar issue.

    My sequences contain lots of integrated EICs and I want to be able to summarise all of the integrated peaks for all of the EICs in each sample.  

    I've created a report template with a table that has a filter for EIC signals only.  Table column headers are "sample name", "signal name" (so I know which signal is from which EIC), then simply "RT", "Height" and "area". You can choose others obvs.

    I run this as a sequence summary report from the sequence output dialogue box and save it as a pdf (looks pretty for reporting) and a .csv file (not .xls - I want the numbers, not the formatting!), so I can get the numbers into excel with copying or pasting. 

    In the .csv file I can select the entire output and filter on "sample name" and "signal name" as I need.  Pivot tables etc can help me manipulate the data further.  I could probably do some (most? all?) of this in the intelligent report, but that's a little beyond my skills at the moment!

    This is on ChemStation C.01.10.

  • Hi

    Here's my step-by-step guide to doing what I think you are asking:

    Create a new Single Sequence Summary report template

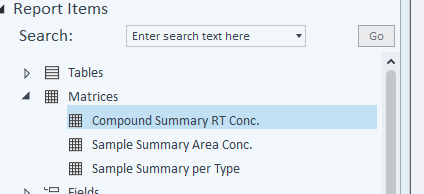
    Add a Compound Summary RT Conc. Matrix

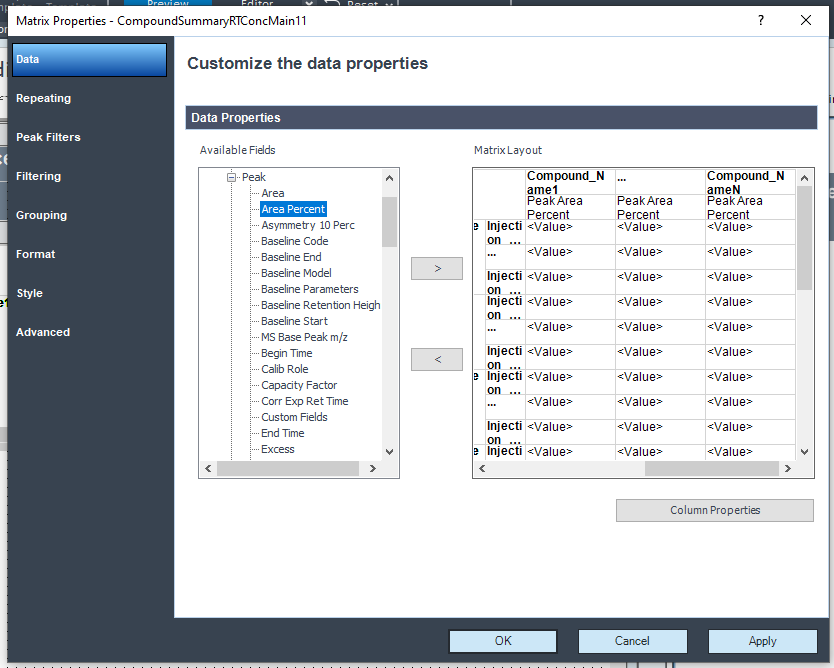
    Customise the columns used in the matrix

    Add the Peak_AreaPercent column and remove the Peak_RT and Compound_Concentration columns

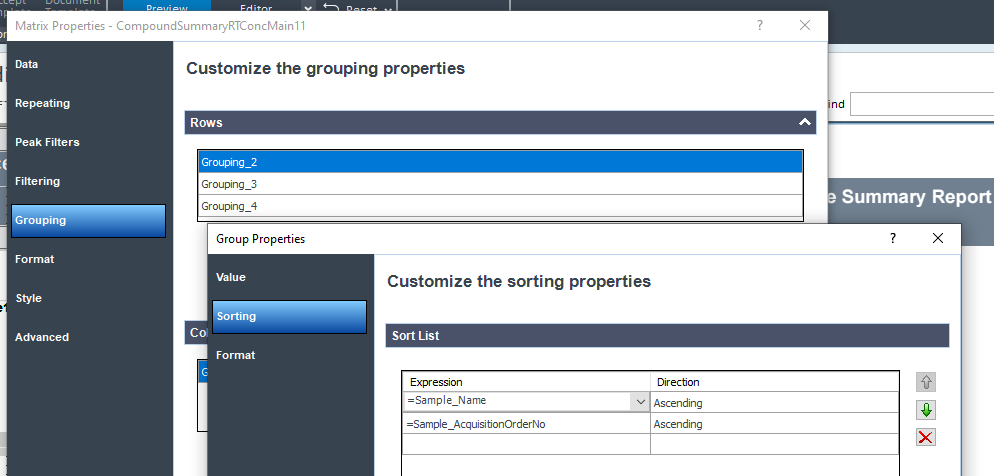
    The matrix sorts the injections alphabetically, rather than by injection order - Change the sort order in the Grouping section.

    Remove the sort by Sample_Name for the first two groups

    This will give you a report perfect for export to Excel.

    Kind regards

    Andy

Was this helpful?