Hallo zusammen,
bin neu hier und bringe gleich zwei Fragen auf den Weg.
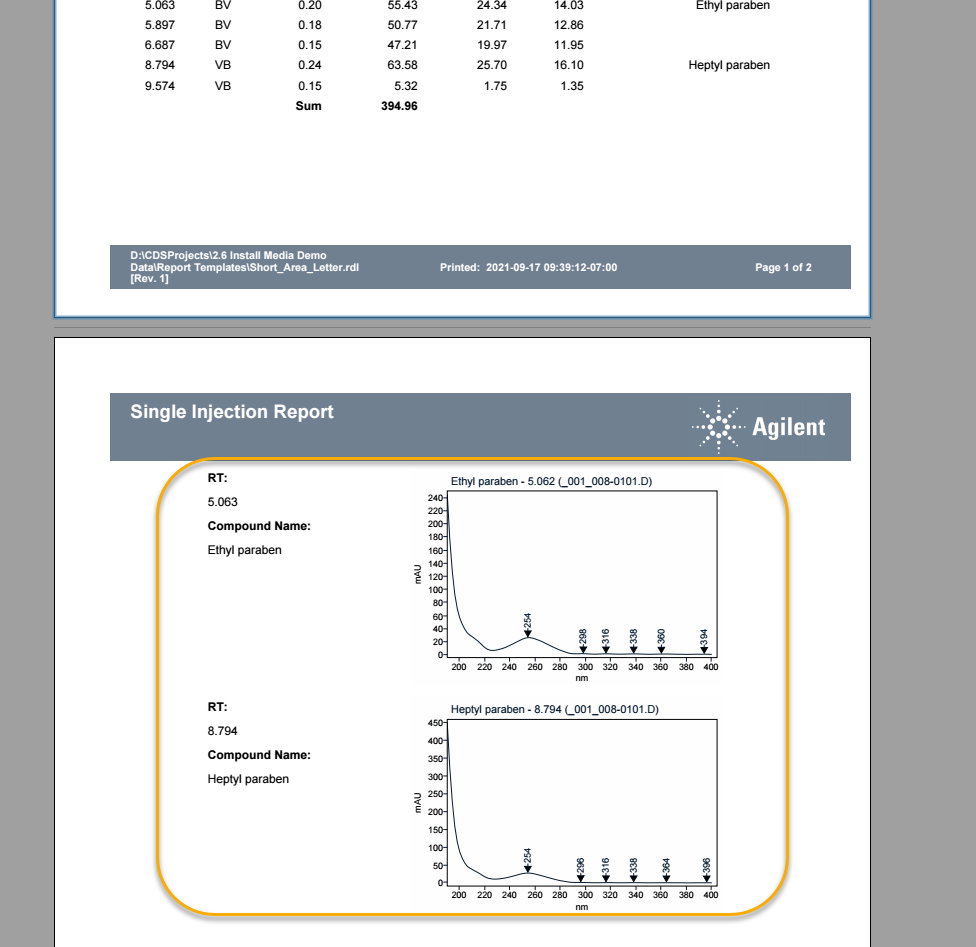
1. Gibt es mit den Software Agilent OpenLab Data Analysis - Build 2.204.6.11 die Möglichkeit die UV-Daten so ins Excel zu transferieren, dass dort eine UV_Spektren_Wave gezeichnet werden kann? Wenn ja, wie?
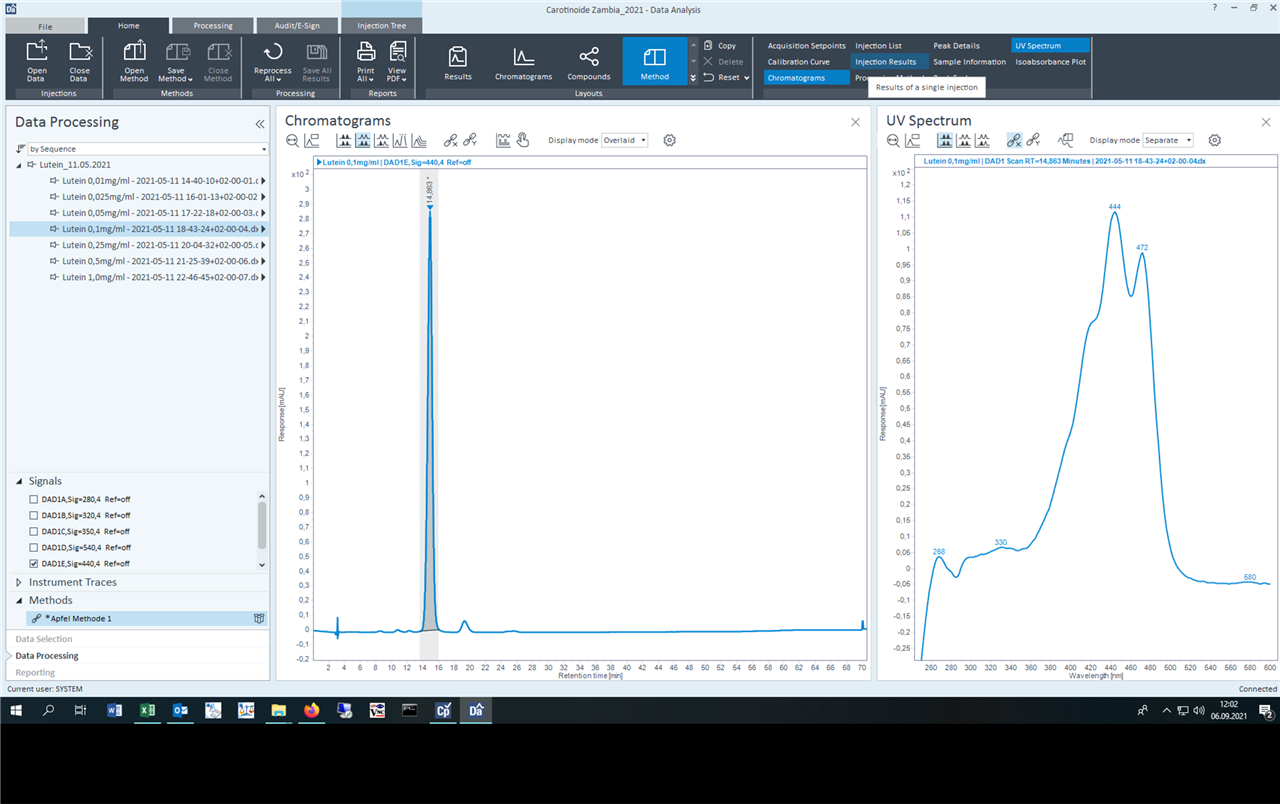
2. Warum ich das frage. Nun. Es hat sich folgendes Problem bei uns ergeben. Und zwar ist dies von einem auf den anderen Tag passiert. Wir messen Carotinoide. Die Anlage ist bis auf den DAD (G1315b; 1100 Series) aus der 1260Infinity Reihe. Als wir den DAD eingebaut haben, hat die Datenaufnahme super funktioniert.
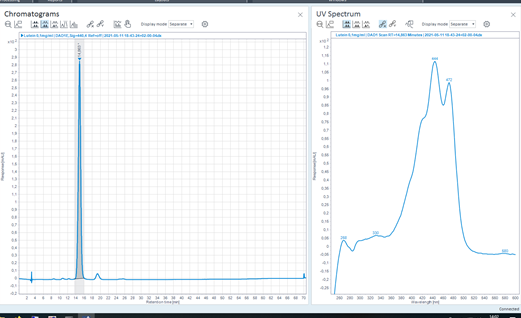
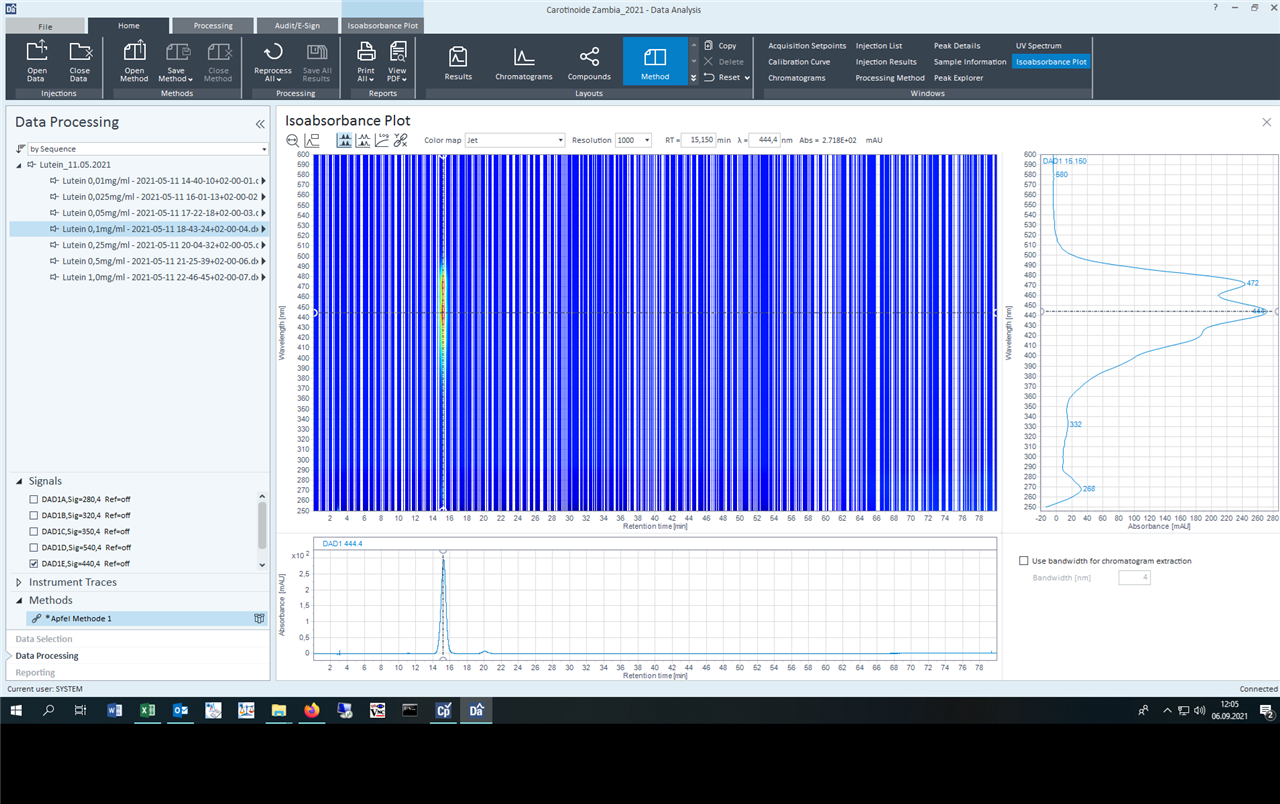
Dann einen Tag später - dieses Ergebnis
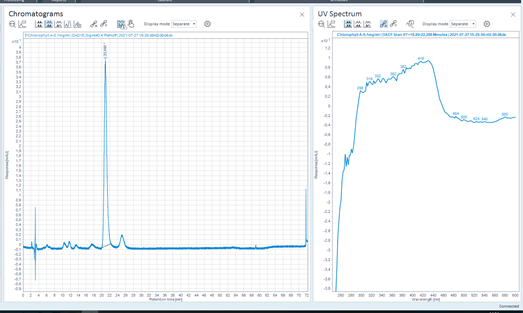
Da die Deuteriumlampe neu ist, haben wir zunächst auf die Tungsten Lampe getipt. Aber das hat auch nichts gebracht.
Im Moment vermuten wir ein Softwareproblem, aber so richtig will uns nichts einfallen. Jetzt die Frage an euch? Hatte dieses Problem schon mal jemand? Konnte es gelöst werden?
Danke schon, und hoffe, ihr könnt mir helfen.
Gruß Anja