SumArea in OpenLab CDS C.01.05 [40], identifiead and unknown peaks

Hello! Please help with the creation of the report in in OpenLab CDS  C.01.05 [40]

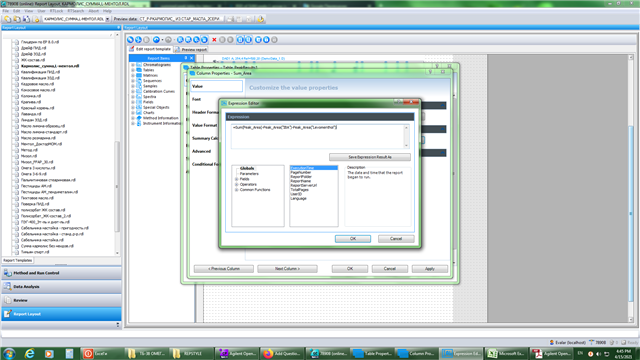
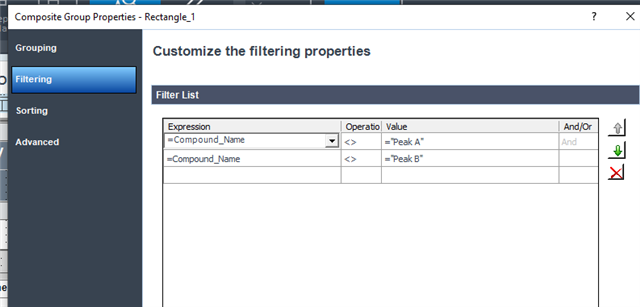
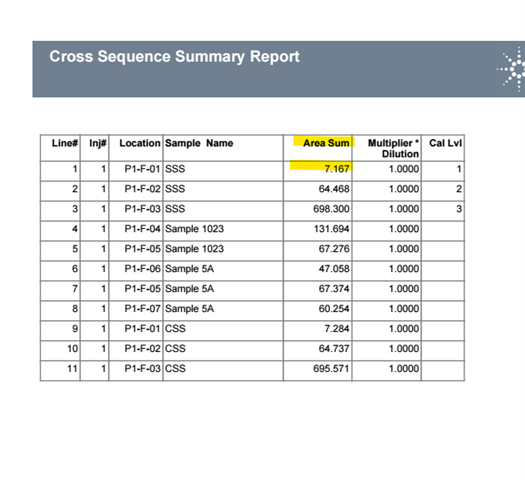
1. I need to calculate the sum of the areas of all the peaks except for the peaks called Isobornyl acetate and levomenthol.

That is, my final formula is:

=SumArea - Area(Isobornyl acetate) - Area(levomenthol)

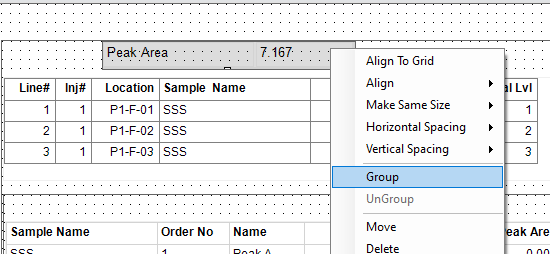
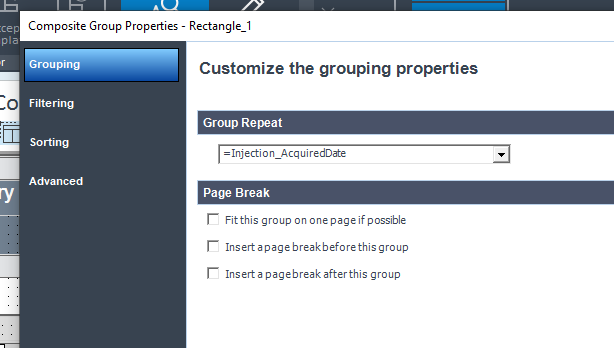
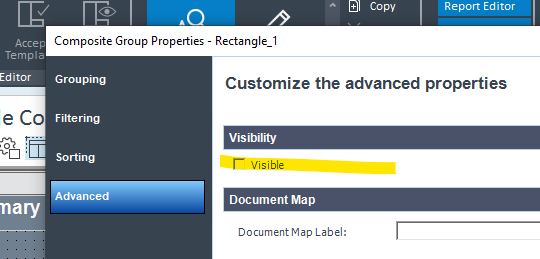
2. The sum of the areas of all peaks should include the area of all peaks: identified and unidentified. But in the report, I would like the unidentified ones not to be displayed, because the list of peaks is very large (3 sheets).

Can anyone help me with this, please?

Parents
  • Update: my formula does not work, as a result, instead of the CDS value, it gives an error.

  • Hello,

    Is this for a summary report or single injection report? I will show an example for a summary report where you need this value per injection. Attached is an example PDF.

    Marty Adams

    Add a single field like peak area to the top of the report and group it with itself.

    In that groups properties, repeat the group by injection ID or acquisition date which are both unique fields for each injection. Also place filters to exclude your named peaks from the group. In my example, I exclude Peak A and Peak B.

    Once this is done the group will contain all peaks except the 2 that were filtered out and will repeat for all injections. Now you can change the value of the field to  =Sum(Peak_Area) and store it as a variable keyed on injection date or ID. 

    You will probably not want to see the field at the top of the report so you can hide that group once you make sure it is working for the value you want. Once this is done you can use that stored value in any table below to display the area sum of all the peaks except the selections that were filtered.

     /cfs-file/__key/communityserver-discussions-components-files/26/Agilent-Example.pdf

Reply
  • Hello,

    Is this for a summary report or single injection report? I will show an example for a summary report where you need this value per injection. Attached is an example PDF.

    Marty Adams

    Add a single field like peak area to the top of the report and group it with itself.

    In that groups properties, repeat the group by injection ID or acquisition date which are both unique fields for each injection. Also place filters to exclude your named peaks from the group. In my example, I exclude Peak A and Peak B.

    Once this is done the group will contain all peaks except the 2 that were filtered out and will repeat for all injections. Now you can change the value of the field to  =Sum(Peak_Area) and store it as a variable keyed on injection date or ID. 

    You will probably not want to see the field at the top of the report so you can hide that group once you make sure it is working for the value you want. Once this is done you can use that stored value in any table below to display the area sum of all the peaks except the selections that were filtered.

     /cfs-file/__key/communityserver-discussions-components-files/26/Agilent-Example.pdf

Children
  • Thank you very much for your work, but for the calculations I need the areas of these unaccounted peaks (only separately from the sum).

    Above, I gave my formulas for calculating the amount of oils and levomenthol (separately from the amount of oils).

    Isobornyl acetate acts as an internal standard,

    Σ is the sum of the areas of all peaks with the exception of the IBA and levomenthol peaks in the test solution,

    a is the mass of the test oil,

    Σ0 is the sum of the areas of all peaks except for the peaks of IBA and levomenthol in a standard solution,

    a0 is the mass of the standard oil.

    From one chromatogram, these two indicators are calculated at once. Therefore, I need to show in one table 1. Areas of all identified peaks (IBA, levomenthol + 6 more) 2. the sum of ALL peaks (identified and unidentified), but minus the peak areas of IBA and levomenthol. 3.If possible, hide unidentified peaks from the table to save space on the chromatogram (I get about 50 peaks), but so that their area is calculated.

  • Very thanks for your work.


    Above, I gave my formulas for calculating the amount of oils and levomenthol (separately from the amount of oils).

    Isobornyl acetate acts as an internal standard,

    Σ is the sum of the areas of all peaks with the exception of the IBA and levomenthol peaks in the test solution,

    a is the mass of the test oil,

    Σ0 is the sum of the areas of all peaks except for the peaks of IBA and levomenthol in a standard solution,

    a0 is the mass of the standard oil.

    From one chromatogram, these two indicators are calculated at once. Therefore, I need to show in one table 1. Areas of all identified peaks (IBA, levomenthol + 6 more) 2. the sum of ALL peaks (identified and unidentified), but minus the peak areas of IBA and levomenthol. 3.If possible, hide unidentified peaks from the table to save space on the chromatogram (I get about 50 peaks), but so that their area is calculated.

  • Hello,

    Due to the age of this forum post I’ve marked this as resolved.  If you are able to please reply to this thread and let us know how the problem was solved. 

    Thanks!

Was this helpful?