Hi all, I’m brand new to this instrument and software and I need help!
We analyze blood samples for ethanol concentration. We use six calibrators and the internal standard, n-propanol.
We also analyze qualitatively for methanol, acetaldehyde, isopropanol, and acetone.
I was able to set up a calibrator report template and a sample report template. The only difference between the two is that the calibrator report template doesn’t show the concentrations.
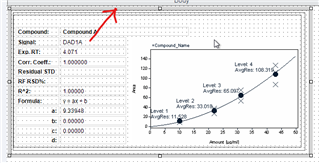
What I want to do, if possible, is to add calibration curves for ethanol on FID1A and FID2B after the the last calibrator (6th vial) has run. Is there some logic statement that will allow the display of just the ethanol calibration curve on page 7 of my calibrator report template?
When I tried adding the Calibration Curve by Compound to my report template, it will print the ethanol curve after EACH calibrator incrementally. So after vial two, I get two points on the curve. After vial three, I get three points on the curve, and so on. I only need this curve after all six calibrators have run and there are six points to put onto the curve. It also displays an attempt to plot my internal standard, n-propanol in the same manner, which I don’t want at all.
Can anyone help?