I am using Mass Hunter for LC QQQ.
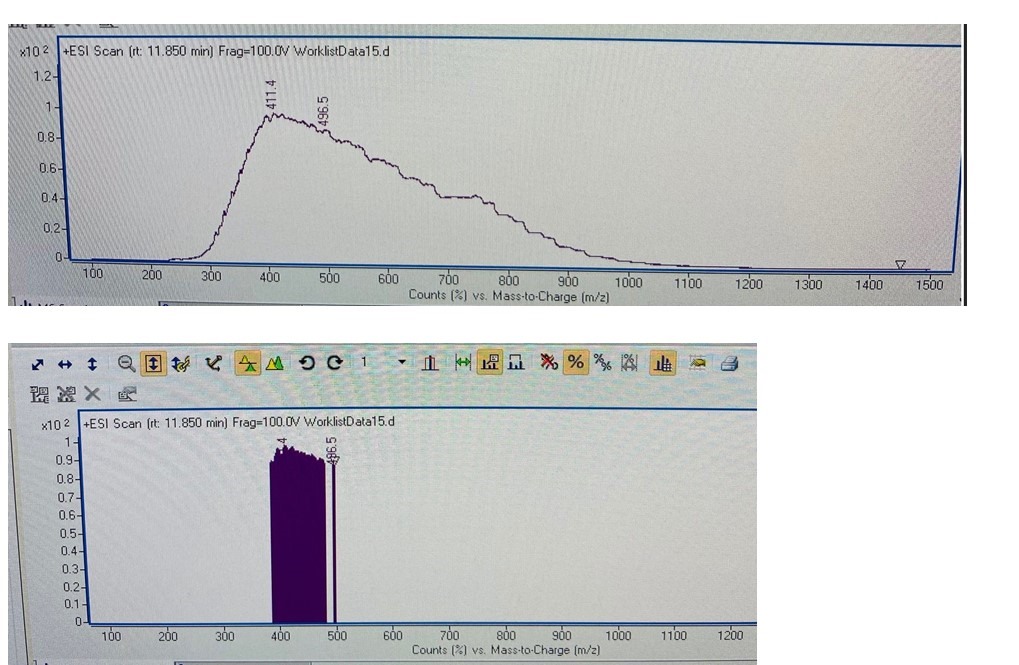
When I am analyzing a data file in the qualitative application, I see my TIC. When I extract MS spectrum for a particular signal in my TIC the spectrum is displaying in the MS Spectrum Results window as another (broad) peak...I believe this is considered "Profile" view of the spectrum????
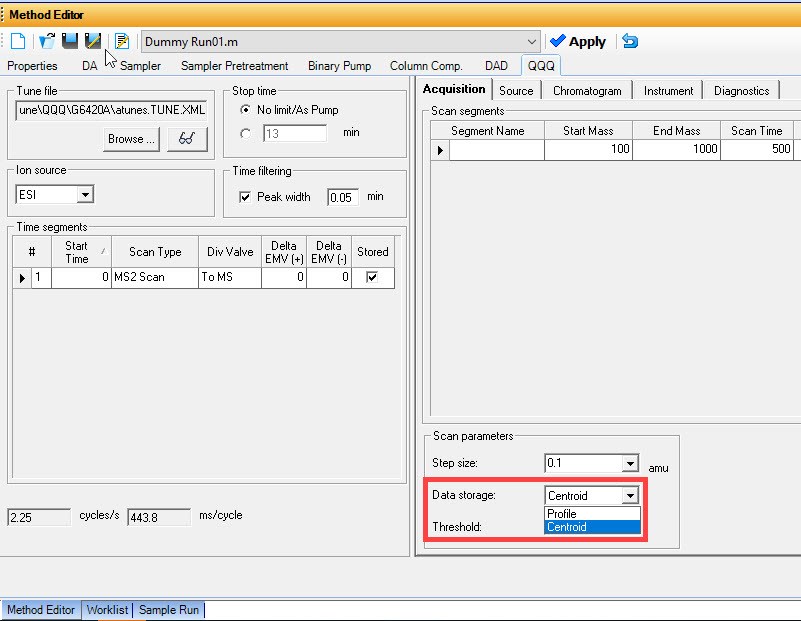
When I was researching how to get a standard view of the Mass spectrum with the "lines/sticks" at each m/z (assuming this is centroid view) I have gone to method editor, I have centroid as the preferred display with profile set as secondary but even then I tried to "convert profile to centroid and replace" but I get an error message that says this cannot be completed because the data file only collected profile data. I dont know how I even got it to collect as "profile" only (this was someone else's method, BTW)
When I go one step further I have right clicked on the extracted scan in the data file panel and clicked the option to view as centroid....it brings up a mess. Essentially a hundred "line/sticks" at the m/z show up but they are all clustered close because the m/z is essentially the same.
I attached images!
Any help would be appreciated so I prevent this going forward