OpenLabs Calibration Table

Hello

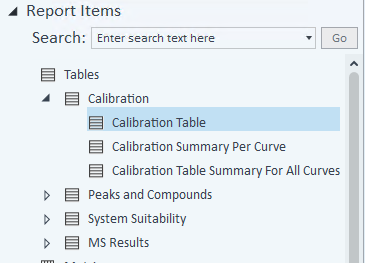
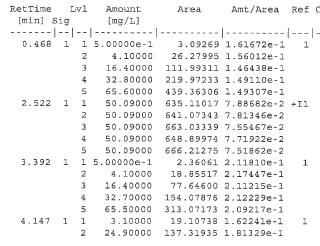
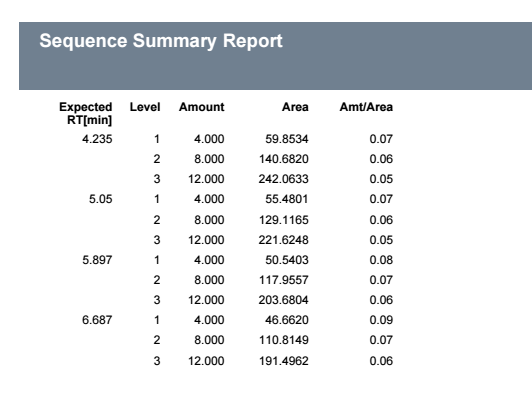
I am going from Chemstation B.04 to OpenLabs 2.4, so this a bit of a big change.  The one thing I am struggling with is how to print a Calibration Table similar to what was available in Chemstatin B.04.  It would list the compounds, concentration for each level, the average area count, etc.  How do you do this in OpenLabs?  Thank you for your help.

  • Hello,


    In OpenLab CDS you will need to use a report template to print out the calibration table. There is a Calibration Table report item which outlines the information you are looking for. You will just need to add that to a new report template and print a report with the last calibration standard data file. 


  • Hi Ryoboyle

    Thank you for the information.  I was able to create  a report with what you suggested, but I am curious if there is a way to make a calibration table similar to this:


    Thank you for your help!

  • Hi


    You can do this with some modifications to a Compound Results table in a sequence summary report, with appropriate sorting and filtering.


    The key filter would be just to include samples that are calibration standards, so the expression for the filter would be Sample_Type, the operator would be "=" and the value would be "=1" (the enumeration for Sample_Type uses the value 1 for calibration standards.


    It took me a few minutes to build a table that looks like this when used with example data containing a 3 level calibration curve.

    Starting with a Single Sequence Summary report, add a Compound results table.


    Apply a filter to the table to show only Calibration Standards:

    Apply sorting to the table

    Delete the columns that you don't need, and change the RT column to display Compound_ExpectedRT for only level 1 samples:

    Add columns for Sample_CalibrationLevel and I replaced the RF column with a custom calculation Compound_CalibAmount/Peak_Area and changed the header

    I can't work out what the other column in your table is.


    As you can see, the table from Chemstation is indeed possible in OpenLab CDS!


    /Andy

  • Hi Andy

    Thank you for the help and guide.  I seem to be really close on what I am looking for based on what you have provided.  The only issues I am running across is that I do not know how to get the program to average the multiple injections we use at each calibration level.  I am not sure it if is something easy to do or if it has to be written as an expression.  Is this something that can be done?  Also my injections are not be sorted from the lowest retention time to the highest, so I must be doing something incorrectly when sorting.


    Thank you

  • Hi


    Sounds like you have the table sorted by descending retention time rather than ascending.


    Is it only the averages you want to display in the table or do you want the individual data points as well?


    /Andy

  • HI Andy

    I would just like the averages displayed in the table.


    Thank you

Was this helpful?