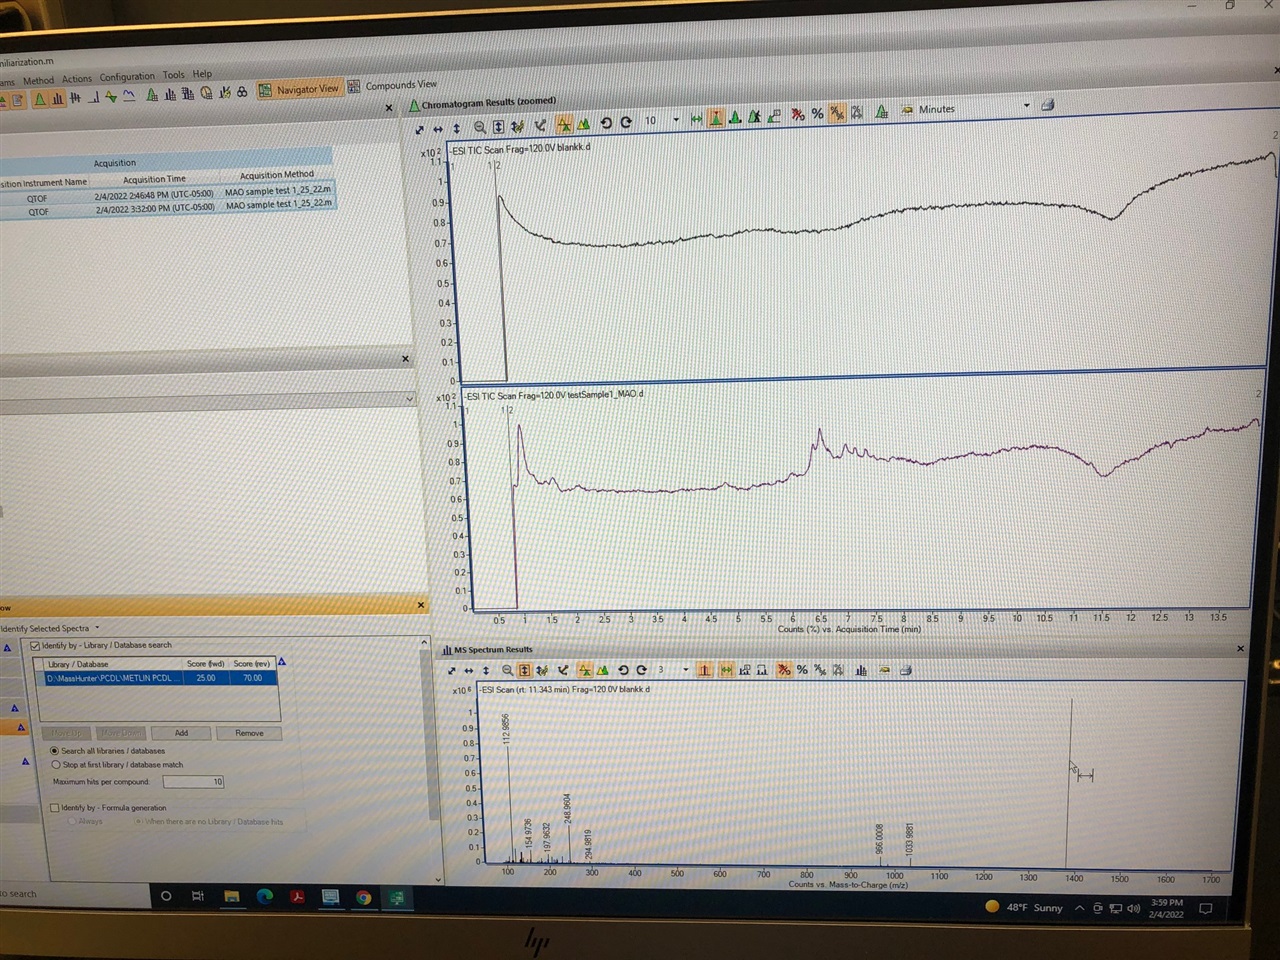
My chromatograms using 6545 LC MS runs above zero on x-axis. What can be the potential reason?

My chromatograms using 6545 LC MS runs above zero on x-axis. What can be the potential reason?
Hi Andy,
No, I still see high background especially TFA mass. I will try that solution and was also thinking about changing the method. When the gradient goes to organic I see higher background!
Hi, Ross, thanks for your useful information. but I still confused about the TIC. I am working with PFAS based on LC/MS Aglient 1260, I also got a high peak at the 1 min in TIC chromatrograms for the balnk sample (pure methanol). I used the new column, purged the LC/MS, mobile phase is Water 10 mM Am-Ac and 80:20 MeOH:ACN10 mM Am-Ac. I ran ubder SIM mode.
so I wonder is the peak are led by those ions come out from the comlumn in 0-2 min also have the m/z value I set in the SIM acqusition method? The ions with its m/z not in the SIM acqusition method will not detected, right?
The QTOF doesn't really work like that. There is no SIM mode like in quadrupole instrument. It collects full spectral data all the time. The only slight advantage to collecting data over a narrower range is that data files are smaller. However, you need to ensure that at a minimum your mass range also includes your reference correction ions (usually 121 and 922).
What you see early in the TIC is probably unretained material from your injection solvents or may just be as your divert valve switches from waste to MS at the time segment. (You can experiment doing no injection run or no switching to see which. (The divert to waste time segment at the start of a run can be useful for keeping unretained junk out of your MS). Its not likely something trapped on the column usually things that are trapped don't elute so early as they require the stronger mobile phase to lute them.
You don't really want to analyze your TIC. Unless this is interfering with compounds of interest I wouldn't be concerned by it. Collect the full data and then extract out chromatograms, Extracted Ion Chromatograms (EICs)of the m/z of interest (to 4 decimal places) or run find by formula algorithm (Targeted workflow) to find the compounds of interest. On a QTOF you effectively filter out the ions of interest in the data analysis stage. On a single or triple quad, you filter them out when you run the sample. Apart from the high resolution and mass accuracy, this is the other big advantage of the QTOF, you have the full spectral data so you can ask more questions from it later if you suspect maybe there was another compound of interest, for example.
If you want to see what ions are making up the early peak (Or any peak for that matter)
much appreciate, Ross, I successfuly confirmed this peak will not influence the quantitative analysis.