Mx3000P additional peak

Hi,

My customer increased the primer concentration and got an additional peak (marked with the red square below) near the main peak. Would you kindly let me know what is the possible reason? Please see the image below. Thank you so much!
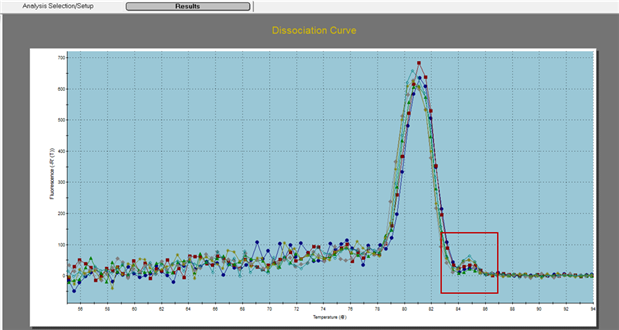
  • Thank you for all your comments and explanations, Albert! I'm asking for the .mxp file.

  • Hello,


    While we do have a general idea of what might be causing this additional peak, we would be better able to support your customer if you could send the original data file (.mxp) in which these results were observed to qpcr@agilent.com<mailto:qpcr@agilent.com>.


    Could you please forward this file?


    Thank you,


    Albert Grafsky


    Manager,


    Technical Services


    Agilent Technologies, Inc.


    T: +1 800 227 9770    |    M: +1 858 229 1118    |     www.agilent.com<http://www.agilent.com/>


    F: +1 858 597 0619    |    al.grafsky@agilent.com


    Follow Agilent on:


  • Before seeing the original .mxp file, one comment that can be made is that higher temperature dissociation peaks such as the one seen here have frequently been associated with the presence of rare splice variants of the target sequence. Alternatively non-specific product formation, due to the primers hybridizing to sequence other than the intended target, has also been known to cause such peaks. Since you indicated that this peak appeared after the customer increased their primer concentration, it seems that the second cause is the more likely.

  • Thank you, Albert. I'll send the file right now.

  • Hi qPCR support team,


    I submitted a question on the community site, about an additional peak from Mx3000P. Following dear Albert’s suggestion, I send .mxp files.


    The additional peaks appears in the file Jan 30 evening, 2019, well C1, D1, G1, F1.


    The customer provided additional information. He is using a kit from a local vendor, and the qPCR reaction is set up as follows,


      1.  The 2 experiments, Jan 30 and Jan 30 evening, used same qPCR set up, difference is the anneal and extend time at 60℃. Jan 30 used 15s for annealing/extending, and Jan 30 evening used 30s.

      2.  Template. For both experiments (Jan 30 and Jan 30 evening), well A1, B1, E1, F1 used undiluted cDNA, while C1, D1, G1, H1 used 10X diluted cDNA as template.

      3.  Primer concentration. A1, B1, C1, D1 used 1ul primer, while E1, F1, G1, H1 used 1.25ul primer.


    Sample Well


    cDNA concentration


    Primer volume


    Anneal / extend time


    Result


    A1, B1 (Jan 30)


    Undiluted


    1ul


    15s


    C1, D1 (Jan 30)


    10x diluted


    1ul


    15s


    E1, F1 (Jan 30)


    Undiluted


    1.25ul


    15s


    G1, H1 (Jan 30)


    10x diluted


    1.25ul


    15s


    A1, B1 (Jan 30 evening)


    Undiluted


    1ul


    30s


    C1, D1 (Jan 30 evening)


    10x diluted


    1ul


    30s


    Additional peak


    E1, F1 (Jan 30 evening)


    Undiluted


    1.25ul


    30s


    G1, H1 (Jan 30 evening)


    10x diluted


    1.25ul


    30s


    Additional peak


    I agree that non-specific production formation possibilities increased due to template dilution, primer increasing, and annealing time increasing. Also increased extending time enables production of longer fragments. Correct?


    Thank you!


    Best regards,

    Lin

    attachments.zip
  • Dear Albert,


    Fully got it, thanks so much for your support.


    Best Regards,

    Lin


    Sent from my iPhone

Was this helpful?