Does anyone know what these bands are in genomic DNA?

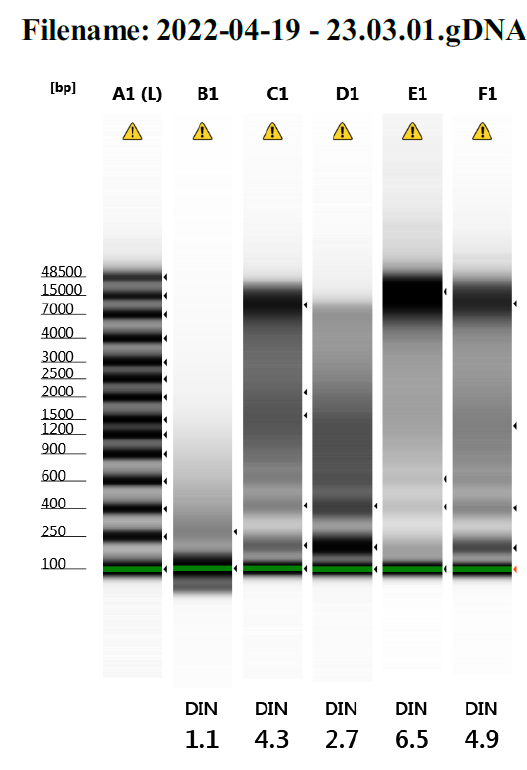
We have tried several times to isolate genomic DNA from fish fin clips using proteinase K and have run the samples on the TapeStation. Sometimes we get high molecular weight DNA, but other times we get what looks like degraded DNA with a series of low molecular weight bands. It is hard for me to imagine that these consistent bands are produced by DNA degradation. Does anyone have any thought on what these are? Thank you for your help.

Parents
  • Dear BobF, Thank you for contacting us. Ladder has all the peaks and have migrated as expected. So the run overall has migrated ok. However, sample lanes and overall run has a slightly smeary profile. That can happen if the sample did not get loaded/ran immediately after preparing. In terms of the issue with the sample lanes, since there was a enzymatic cleavage step, please make sure that final sample buffer composition is compatible with the gDNA screentape assay. Maximum buffer concentration in the sample for gDNA assay can be 10 mM MgCl2, 50 mM NaCl, 10 mM NaOAc, 10 % ethanol, 10 % 2-propanol, 1 µg/µL glycogen. Additionally, please refer to good measurement practices for sample preparation, specifically, pages 97, 98 of the 4200 TapeStation manual. If further assistance is needed, please email raw data files ending with .gDNA to electrophoresis@agilent.com. Default location is C:\Users\XXXX\Documents\Agilent\TapeStation Data. Thank you, Shweta

Reply
  • Dear BobF, Thank you for contacting us. Ladder has all the peaks and have migrated as expected. So the run overall has migrated ok. However, sample lanes and overall run has a slightly smeary profile. That can happen if the sample did not get loaded/ran immediately after preparing. In terms of the issue with the sample lanes, since there was a enzymatic cleavage step, please make sure that final sample buffer composition is compatible with the gDNA screentape assay. Maximum buffer concentration in the sample for gDNA assay can be 10 mM MgCl2, 50 mM NaCl, 10 mM NaOAc, 10 % ethanol, 10 % 2-propanol, 1 µg/µL glycogen. Additionally, please refer to good measurement practices for sample preparation, specifically, pages 97, 98 of the 4200 TapeStation manual. If further assistance is needed, please email raw data files ending with .gDNA to electrophoresis@agilent.com. Default location is C:\Users\XXXX\Documents\Agilent\TapeStation Data. Thank you, Shweta

Children
Was this helpful?