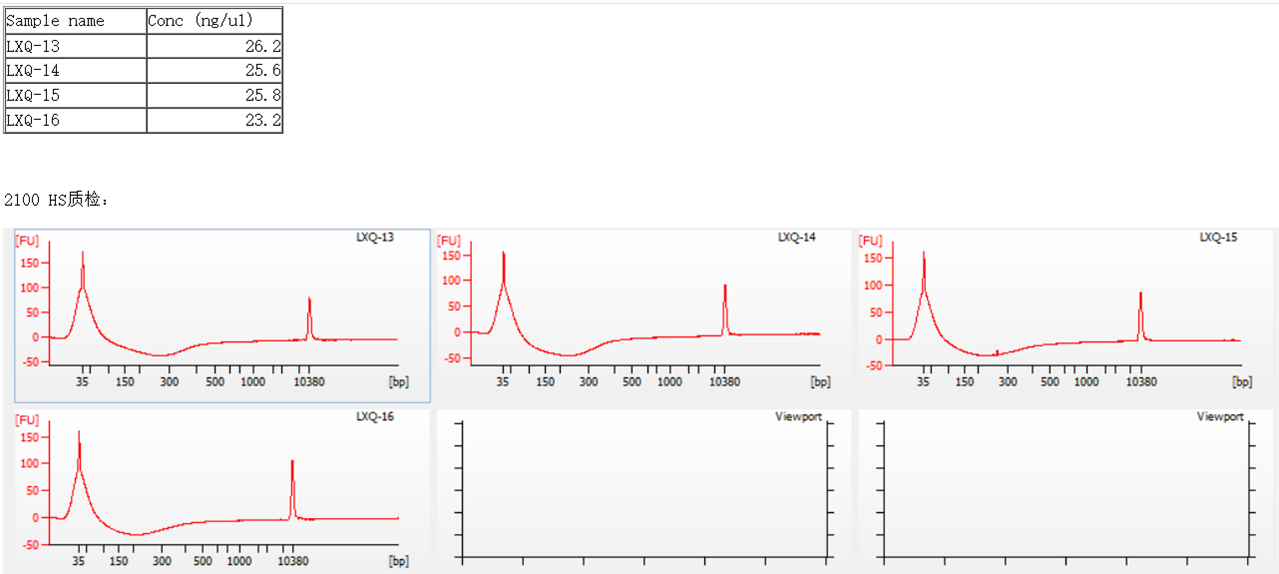
when theTSA Input DNA was used to determine fragment sizes, the results were always bad (attached is the result map), anybody knows what are the reasons for the strange map?

when theTSA Input DNA was used to determine fragment sizes, the results were always bad (attached is the result map), anybody knows what are the reasons for the strange map?

Hello Leo, Thank you for your query. From the screenshot it is not clear how does rest of the run, particularly, ladder well looks like. If ladder well has migrated normally and it has the expected peaks (for ladder, lower and upper marker), then this would be related to specific sample. For optimal run performance, it is recommended to ensure that the samples are loaded within the sizing and quantitative range for the kit in use. Also, sample buffer composition should be per assay specifications.
For DNA high sensitivity (HS) assay: Quantitative range for NGS sheared DNA or libraries is between 100pg/μL to 10 ng/μL and for PCR samples between 5 – 500pg/μL. Sizing range is 50-7000 bp. Maximum salt concentration can be upto 10 mM Tris and 1 mM EDTA. Detailed assay specifications are listed in the DNA HS kit guide.
I hope this helps. For further troubleshooting assistance, please email the following information to us. Your local support team can be contacted here:
Thank you, Shweta