ICP-OES standard response and "H" bar positioning.

We have had an issue recently after introducing a new set of multi-element standards (increasing our typical number of elements from ~6-7 elements to ~26 elements) with our new Agilent 5800 ICP-OES.  Specifically, when using these new standards, we are seeing a reduction in the placement of the “H” bar on the new multi-element standards regardless of concentration, and dropping in placement/value with increasing concentration of standard.  This reduction in “H” bar placement has a negative impact on the calibration curve and the resulting values of the sample analysis.  I've included screenshots below to illustrate what we are seeing.

I'm not sure if this is an issue with sample prep, element interference, an instrument issue, or a software issue.  For the purposes of this post, I wanted to look at the software side of things to at least get a better understanding of the “H” bar, how it plays into the calibration and analysis calculations, and if/how we can make adjustments to improve the performance/placement of the “H” bar to improve our resulting sample analysis values.

If you could look at the pics below and advise on helping us understand what is going on, it would be greatly appreciated.  Thanks!!


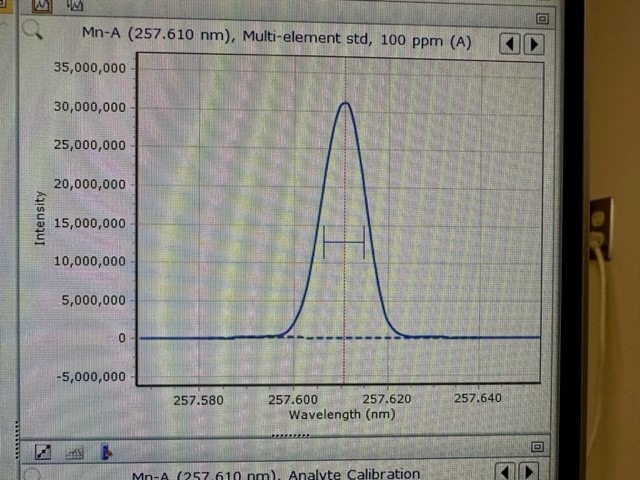
The peak below is our older 5-6 element 100 ppm std. Good counts, high “H” bar:


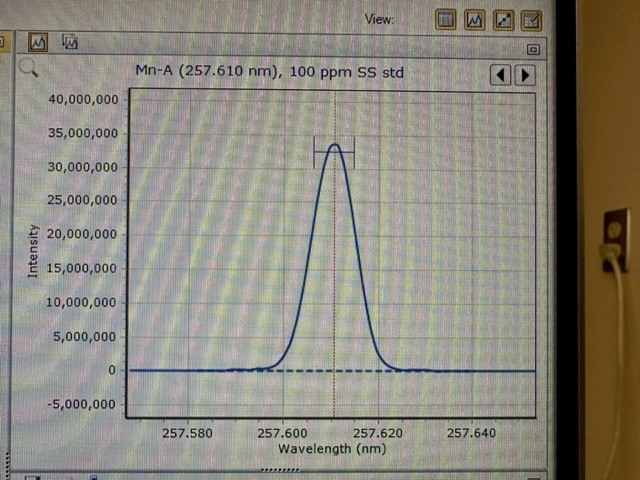
Below is our new ~25 element standard at 100 ppm. Similar peak height, but the “H” bar from which the average response is taken,  is much lower. What accounts for this, and is this something that can be modified in the software.  If not-  what would cause this (spectral interference, solids loading, etc.)?:

Parents
  • The "H" bar indicates where the intensity counts will be calculated for the analyte peak. You did not mention it, but it appears you are using an internal standard. Check the internal standard ratio for this solution, and you will probably find the ratio is significantly higher than 1.0 indicating that your internal std element is present in the calibration standard.   

Reply
  • The "H" bar indicates where the intensity counts will be calculated for the analyte peak. You did not mention it, but it appears you are using an internal standard. Check the internal standard ratio for this solution, and you will probably find the ratio is significantly higher than 1.0 indicating that your internal std element is present in the calibration standard.   

Children
  • Tina,

     Thanks for your reply.  I should have mentioned it- but no, we aren't using an ISTD for the calibration.  We are using a three point curve using external standard weight %.  We are just confused as to why the software is picking an intensity that isn't closer to the peak maximum- as in the previous example I posted- and what controls that- and is there a way to modify where the H bar is selected?

       It's strange:  For the previous metals mixes we have used, the H bar is in approximately the same position for each point in the curve prepped from a stock solution (usually ~ 80% of peak height/intensity).  For one of our new stock standards however, the peak intensity of the H bar is dropping with each standard (from low to high)- even though the intensity corresponding to the actual max peak for each standard is almost perfectly linear.  Thanks for your assistance!

Was this helpful?